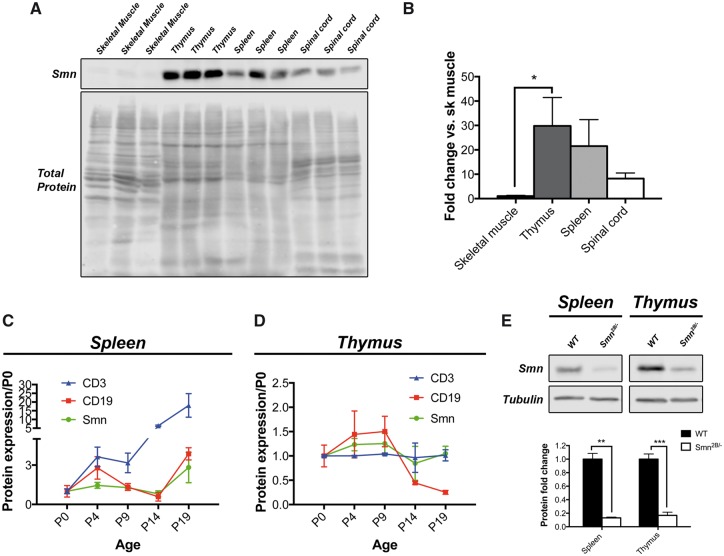
Figure 10.
High levels of Smn protein in lymphoid organs during postnatal development. (A) Western blot analysis of Smn in different tissues of P19 wild type mice. The membrane stained for total protein is shown in the panel below. (B) Quantification of the western blot highlights the relative high Smn protein expression in the thymus and in the spleen compared to skeletal muscle and spinal cord. (C) Quantification of western blot analysis of the temporal protein expression profile of CD3, CD19 and Smn in spleen from wild type mice shows a relatively sustained Smn expression that is similar to CD3 and CD19. (D) Quantification of western blot analysis of the temporal protein expression profile of CD3, CD19 and Smn in thymus from wild type mice shows sustained expression for all three proteins. (E) Smn levels in the Smn2B/- spleen and thymus were reduced as expected. (n = 3 in A and B, n = 2 for each time point in C and D, and n = 4 for E. One-way ANOVA with bonferroni post-test for B and two-tailed Student’s t test for E, P ≤ 0.05 for *, P ≤ 0.01 for **, and P ≤ 0.001 for ***).

