Figure 4.
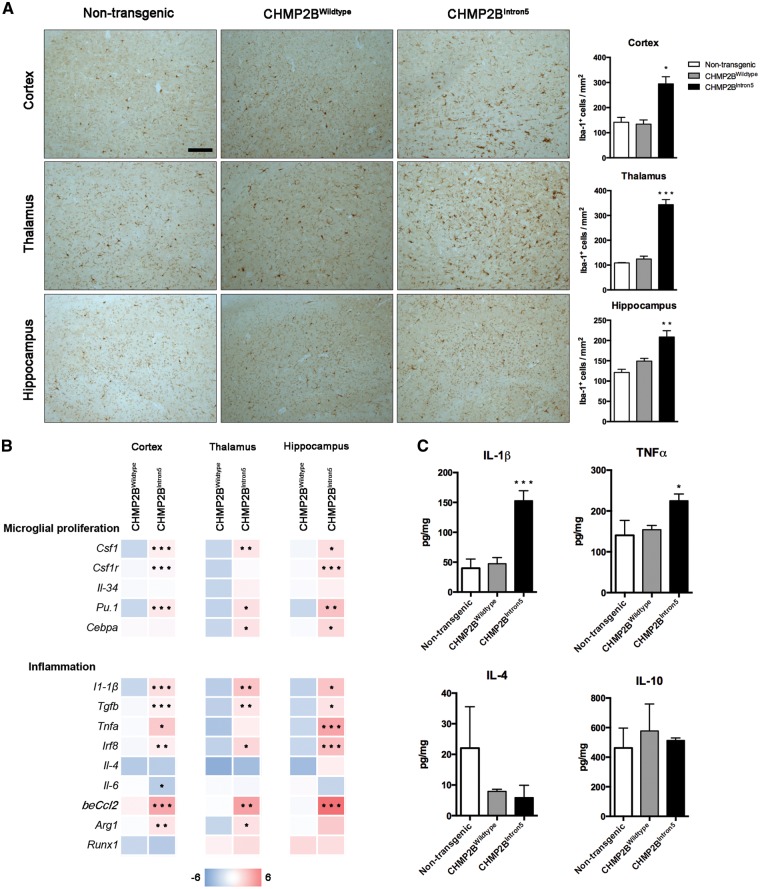
Late stage neuroinflammatory changes in CHMP2BIntron5 mouse brain. (A) Representative microphotographs and quantification of microglial cells (Iba-1) in cortex, thalamus and hippocampus of 18-month-old non-transgenic, CHMP2BWildtype and CHMP2BIntron5 mice (n = 3 per group). Scale bar: 100 μm. Data are shown as mean ± SEM. *P < 0.05, **P < 0.01, ***P < 0.001 versus non-transgenic. (B) Analysis of mRNA levels of microglial proliferation and inflammation associated genes in cortex, thalamus and hippocampus of 18-month-old non-transgenic, CHMP2BWildtype and CHMP2BIntron5 mice (n = 4 per group). Data are represented with a colour code (blue to red) as fold change of CHMP2BWildtype versus non-transgenic and CHMP2BIntron5 versus non-transgenic from −6 to 6. *P < 0.05, **P < 0.01, ***P < 0.001 versus CHMP2BWildtype. (C) Protein analysis of cortical samples showing a significant overexpression of proinflammatory cytokines (n = 4 per group). Data are shown as mean ± SEM. *P < 0.05, ***P < 0.001 versus both non-transgenic and CHMP2BWildtype.

