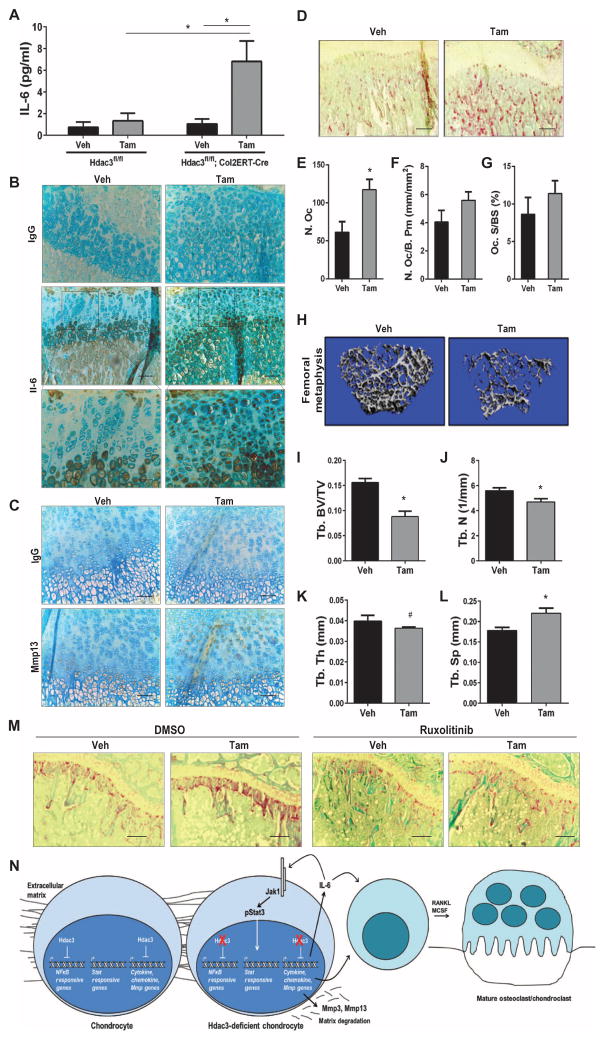
Fig. 6. HDAC3-deficient chondrocytes increase inflammatory responses and osteoclast proliferation in vivo.
(A) ELISAs for IL-6 on sera collected from 2-week-old Hdac3f/.fl;Cre− or Col2ERT-Cre+ mice. (B) Immunohistochemistry for IL-6 on sections from 4-week-old tibiae. Scale bars, 100 μm. (C) Immunohistochemistry for MMP13 on tibia sections from P9 Hdac3-CKOCol2ERT or control mice. (D) Tibiae from 4-week-old Hdac3-CKOCol2ERT and control animals were stained for TRAP. Shown are representative images of the primary spongiosa. Scale bars, 200 μm. (E to G) Histomorphometric quantification of osteoclast parameters from 4-week-old Hdac3-CKOCol2ERT mice: (E) total number of osteoclasts (N. Oc), (F) number of osteoclast per bone perimeter (N. Oc/B. Pm), and (G) osteoclast surface per bone surface (Oc. S/BS) (n = 3 for control animals and n = 4 for CKO animals). (H to L) Micro-CT analysis of bone architecture from 8-week-old Hdac3-CKOCol2 mice. (H) Micro-CT reconstructions of the cancellous bone. (I to L) Quantification of micro-CT data on trabecular bone volume fraction (Tb. BV/TV) (I), trabecular number (Tb. N) (J), trabecular thickness (Tb. Th) (K), and trabecular separation (Tb. Sp) (L) (n = 5 mice for each group). (M) Tibiae from 6-week-old Hdac3-CKOCol2ERT mice were treated with ruxolitinib for 2 weeks and were TRAP-stained. Shown are representative images of the primary spongiosa. Scale bars, 200 μm (n = 3 vehicle/vehicle and tamoxifen/vehicle mice, 5 vehicle/ruxolitinib mice, and 4 tamoxifen/ ruxolitinib mice). In (A) to (M), *P = 0.05 and #P = 0.14, Student’s t test. (N) Working model. HDAC3 suppresses production of cytokines and catabolic matrix enzymes in chondrocytes during bone development.

