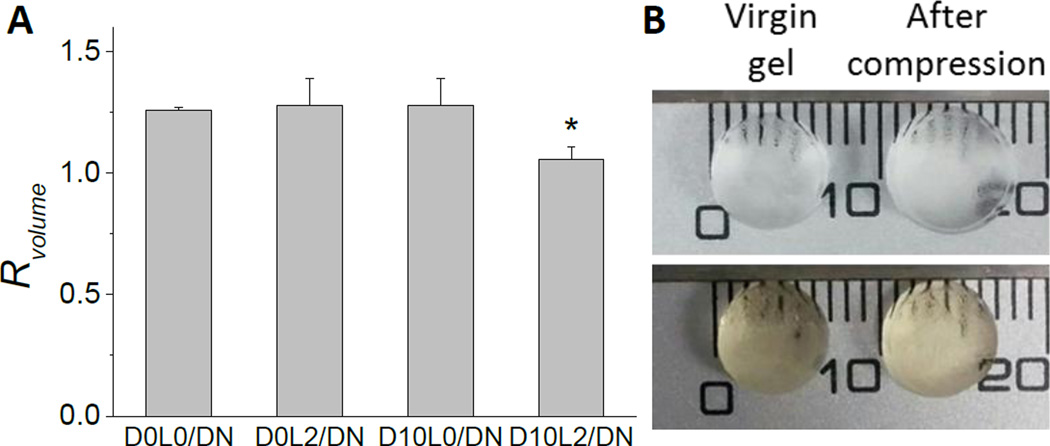
Fig. 5.
The ratio of the volume (Rvolume) of DN after compression to a strain of 0.5 when compared to virgin DN (A). Data is presented as mean ± SD (n=3). *p<0.05 when compared to D0L0/DN, D0L2/DN, and D10L0/DN. Photographs of D0L0/DN (top) and D10L2/DN (bottom) in the virgin state and after compression (B).

