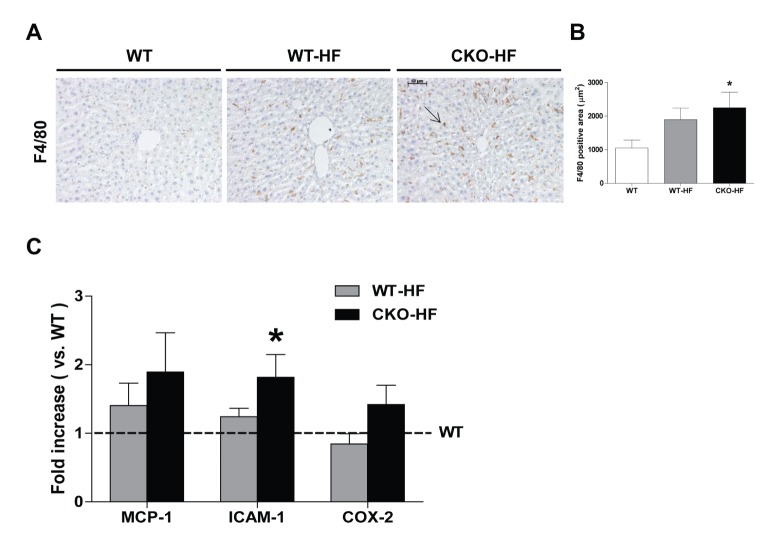
Fig. 3. Catalase deficiency accelerates liver inflammation.
(A and B) Representative immunohistochemistry staining of F4/80 (1:500) and quantification of F4/80 positive area in liver. Magnification, 200x; scale bar, 50 µm. (C) Monocyte chemoattractant protein-1 (MCP-1), intercellular adhesion molecule 1 (ICAM-1), and cyclooxygenase-2 (COX2) were determined by real-time PCR. Data are shown as mean±SE of 6 mice per group. *p<0.05 vs. WT.

