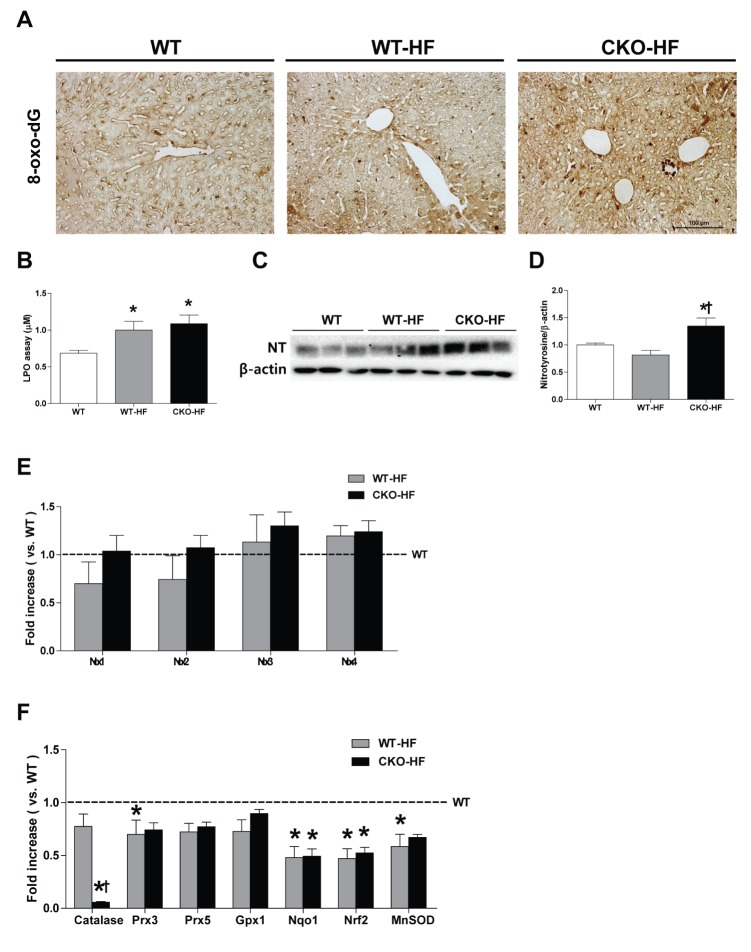
Fig. 6. Catalase deficiency accelerates liver oxidative stress and affects other antioxidant defense systems in the liver.
(A) Representative 8-oxo-dG staining (1:200) in the liver. Magnification, 200x; scale bar, 100 µm. (B) Lipid peroxidation products were measured by LPO assay. (C and D) Hepatic nitrotyrosine (NT) expression were analyzed with western blot. (E) mRNA expression of NOX 1~4 was described in the methods. (F) Catalase, peroxiredoxin 3, 5 (Prx3, Prx5), glutathione peroxidase (GPx1), NAD(P)H dehydrogenase (quinone)-1 (NQO1), nuclear factor (erythroid-derived 2) like-factor 2 (Nrf2), manganese superoxide dismutase (MnSOD) mRNA expressions were measured by real- time PCR as described in methods. Data are shown as mean±SE of 6 mice per group. *p<0.05 vs. WT; †p<0.05 vs. WT-HF.

