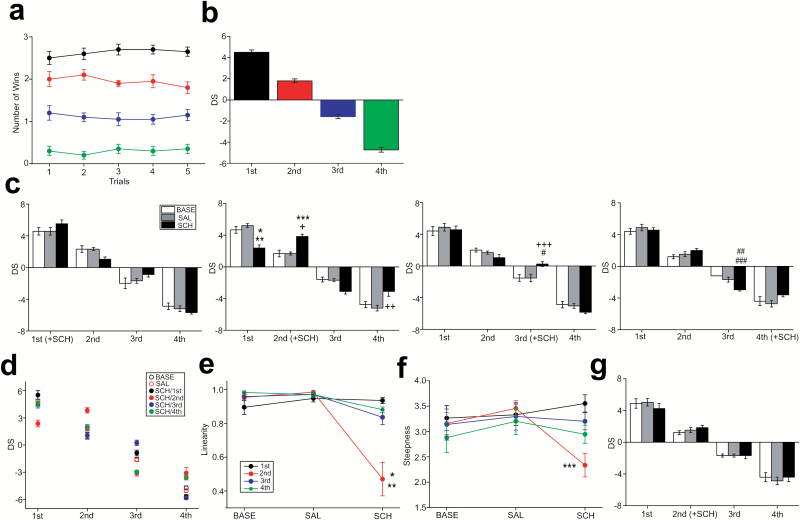
Figure 1.
Alterations of social hierarchy in mouse groups by the D1 antagonist. (a) A graph showing a stable, linear hierarchy in all tested groups at the baseline (BASE) condition expressed as a number of wins over 5 trials of the tube rank test. Black, red, blue, and green colors indicate mice at first, second, third, and fourth rank, respectively, in each group. Error bars in the graphs indicate SEM. (b) A graph showing David’s score (DS) of mice at each rank in the BASE condition. (c) Graphs showing alterations of DS with SCH23390 (SCH) administration in mice at each rank (graphs from the left to the right showing SCH administration of first to fourth rank). *P<.001 vs BASE, **P<.001 vs SAL, ***P<.001 vs BASE, †P<.001 vs SAL, ††P=.001 vs SAL, †††P=.033 vs BASE, #P=.033 vs SAL, ##P<.001 vs BASE, ###P=.033 vs SAL. (d) A graph showing DS of mice at each rank that illustrates the linearity and steepness of the hierarchy in the BASE, saline (SAL), and SCH conditions. (e-f) Graphs showing the linearity (e) and steepness (f) of the hierarchy. *P<.001, **P<.001, ***P=.003. (g) A graph showing DS with SCH administration into the second-rank subject, but the drug-administered mice were isolated for 6 hours before returning to the groups.

