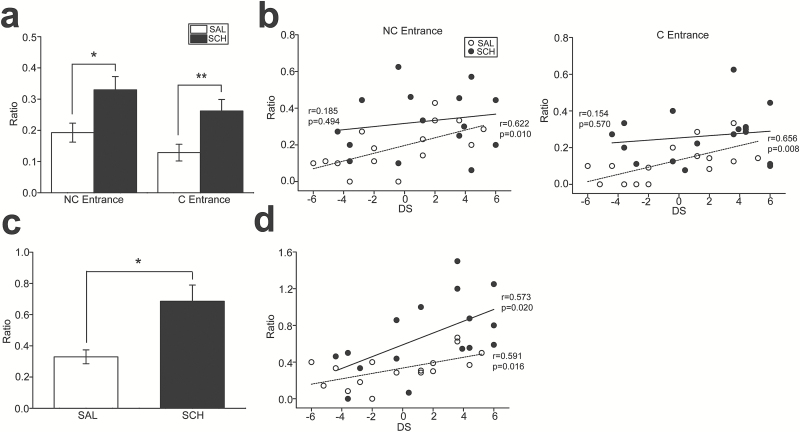
Figure 3.
Associations between cognitive alterations and social hierarchy, and their modulations by the D1 antagonist in mice. (a) A graph showing the ratio of nonconsecutive (NC entrance) and consecutive (C entrance) reentries into the previously visited arms relative to the total number of arm entries in the random foraging task. *P=.008, **P=.028. (b) Graphs showing the correlations between DS and the number of NC (left) and C (right) entries with saline (SAL) and SCH23390 (SCH) administration. The dashed and solid lines indicate the linear regression analyses for SAL (open circles) and SCH (black circles) administration, respectively. (c) A graph showing the ratio of the number of opened-arm entries relative to the number of enclosed-arm entries in the elevated plus maze task. *P=.004. (d) A graph showing the correlations between David’s score (DS) and the number of opened-arm entries with SAL and SCH administration. The dashed and solid lines indicate the linear regression analyses for SAL and SCH administration, respectively.

