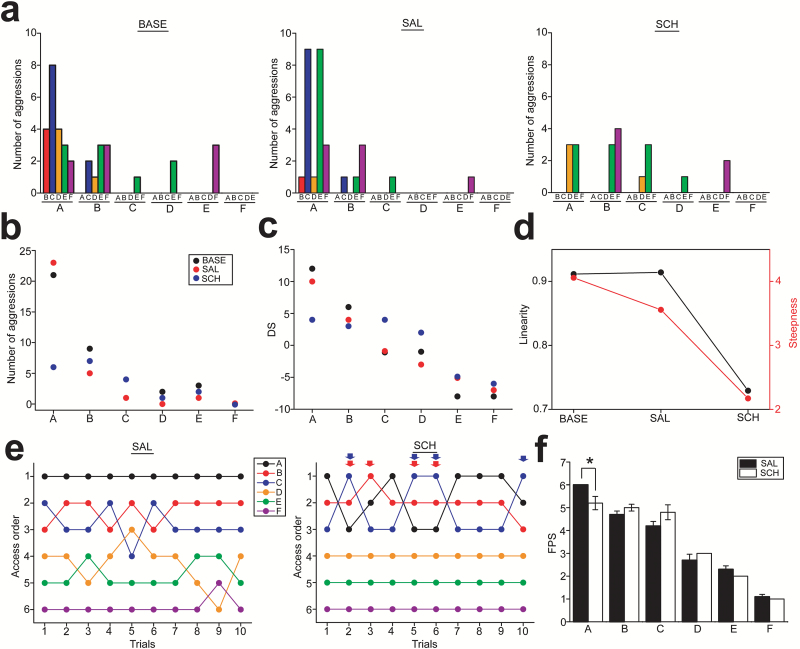
Figure 4.
Alterations of social hierarchy in the nonhuman primate group with D1 antagonist administration into the second-rank subject. (a) Histograms showing the number of aggressions that a subject made against each of other group members during the observation periods in the baseline (BASE), saline (SAL), and SCH23390 (SCH) conditions. The letters A to F at the bottom of the X-axis indicate the initiators, and the smaller letters above them indicate the receivers. (b) A graph showing the total number of aggressions that each subject made to all other group members in the BASE (black circles), SAL (red circles), and SCH (blue circles) conditions. (c) A graph showing the David’s score (DS) of the subjects at each rank in the BASE, SAL, and SCH conditions. (d) A graph showing the linearity and steepness of the hierarchy in group. (e) Diagrams showing the order of food access in each subject in the food priority test under the SAL (left) and SCH (right) conditions. The orders of food access and trials are shown on the y- and x-axes, respectively. The red and blue arrows indicate the events when the drug-treated (second rank; red circles) or third rank subject accessed food prior to the first-rank subject in the SCH condition. (f) A graph showing the average of the food priority score (FPS) over 10 trials in each subject under the SAL and SCH conditions. *P=.043.

