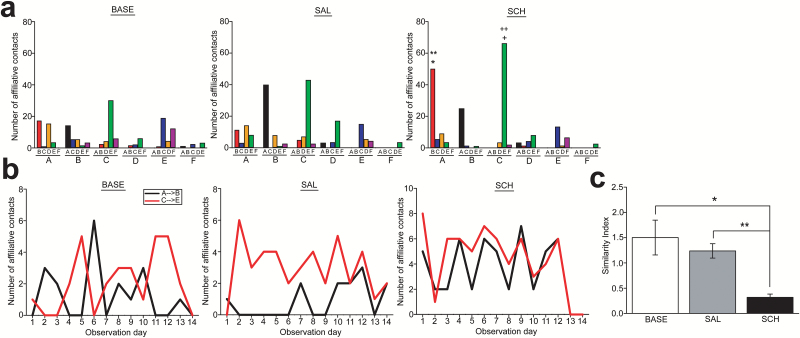
Figure 6.
Alterations of social affiliations in the nonhuman primate group with D1 antagonist administration into the second-rank subject. (a) Histograms showing the number of affiliations that a subject made against each of other group members in the baseline (BASE), saline (SAL), and SCH23390 (SCH) conditions. The letters A to F at the bottom and the letters above them indicate the initiators and receivers, respectively. *P=.005, vs A→B in BASE; **P=.001, vs A→B in SAL; †P=.02, vs C→E in BASE; ††P=.042, vs C→E in SAL. (b) Graphs showing the affiliations from the subjects A to B (black line) and from the subjects C to E (red line) on each observation day in the BASE (left), SAL (middle), and SCH (right) conditions. (c) A graph showing the similarity index for the affiliative contacts between A→B and C→E. *P=.001, **P=.014.

