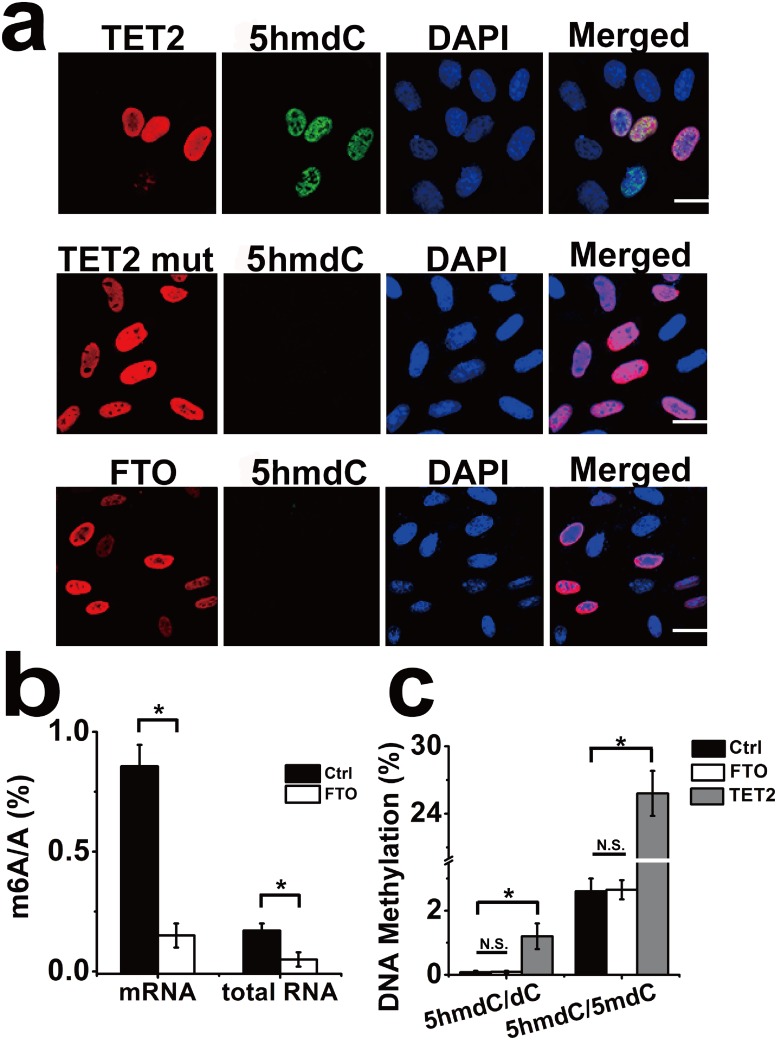
Fig 3. Immunofluorescence and LC-MS-MS experiments measure the demethylation activity of FTO in vivo.
(a) Immunofluorescence analysis of 5hmdC level generated from 5mdC in FTO or TET2 overexpressed Hela cells. Cells were stained with anti-5hmdC antibody (green), showed that 5hmdC signal is obvious in the TET2 overpexpressed cells, instead of TET2 mutant or FTO gene transfected cells. Nuclei are stained by DAPI. Scale bar: 0–50 μm. (b) LC-MS-MS quantification analysis showed percentage of m6A/A in mRNA and total RNA isolated from control and FTO overexpressed cells. (c) LC-MS-MS quantification analysis showed percentage of 5hmdC/dC, 5hmdC/5mdC in DNA isolated from control, FTO and TET2 overexpressed cells. *p < 0.05; N.S.: No Significance. Error bars, mean ± S.E.M. for triplicate experiments.

