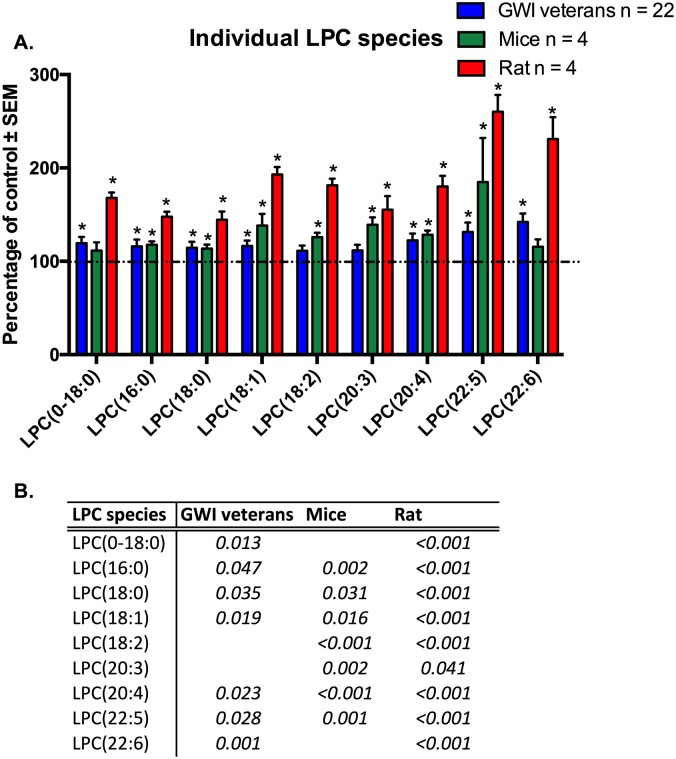
Fig 7. Individual molecular species of LPC are elevated in plasma from veterans with GWI, rodent model and mouse model of GWI.
A. (blue) Percentage of control ± SEM (n = 11 controls, 22 GWI) showing elevated LPC species in GWI subjects compared to controls. (green) Percentage of control ± SEM (n = 4 per group) for the PB+PER model showing that most of these species were also elevated in exposed mice. (red) Percentage of control ± SEM (n = 6 sham, n = 5 exposed rats) showing elevated LPC species in GW agent exposed rats compared to control rats. B. P values for all significant PL species in GW veterans and rodent models.*p<0.05; MLM regression with post hoc analysis.

