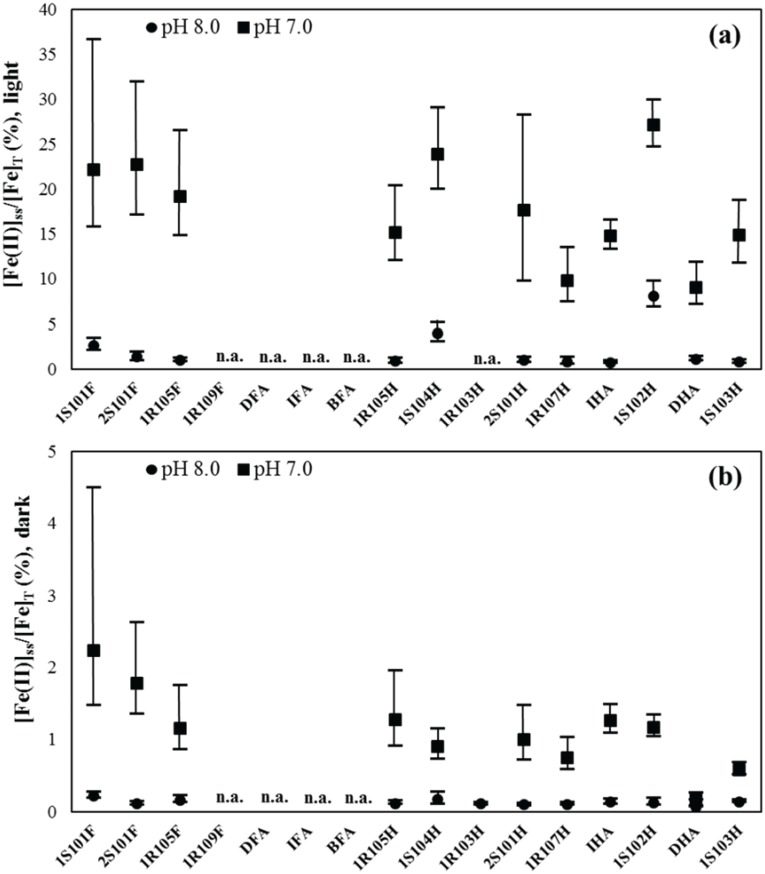
Fig 3. Computed steady-state Fe(II) fractions (a) in the presence of simulated sunlight and (b) under dark conditions for standard HS at pH 7.0 and 8.0.
The upper and lower whiskers indicate maximum and minimum range values, respectively (see Table 1 for detailed values). “n.a.” indicates no data available.

