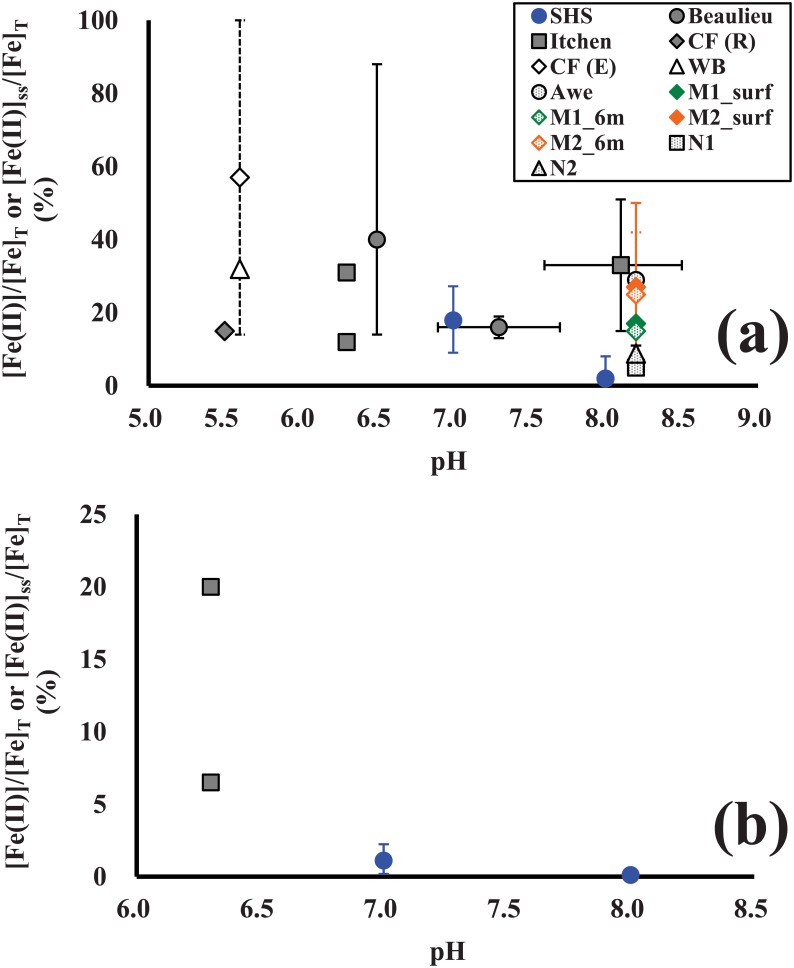
Fig 4. Fe(II) fractions ([Fe(II)]/[Fe]T, or [Fe(II)]ss/[Fe]T) in fresh and estuarine waters, as well as solutions of standard HS (SHS) and size-fractionated NOM, plotted as a function of pH: (a) the Fe(II) fractions during daytime or in the presence of simulated sunlight and (b) the Fe(II) fractions during night-time or in the dark condition.
Source data and abbreviation for each site or sample are summarized in Table 2. A data point for the site or sample with n ≥ 2 represents the mean value (represented by symbols) and their minimum and maximum values (represented by the upper and lower whiskers, respectively, except for N1 and N2 with whiskers indicating the standard deviation). Data points for M1 and M2 indicate the mean values for high-molecular-weight and low-molecular-weight NOM fractions.

