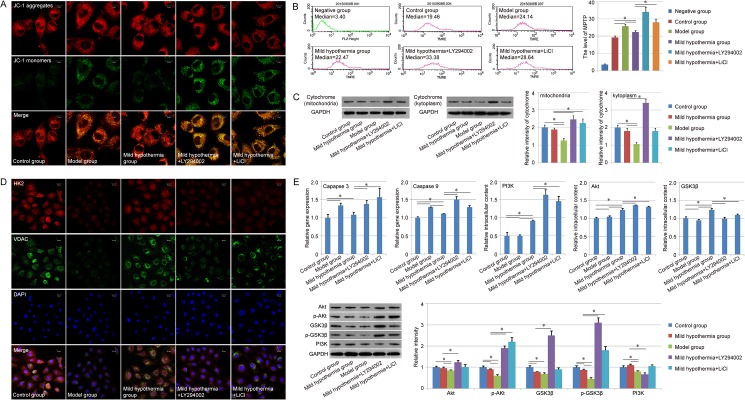
Fig 3. Mitochondrial mechanism of the pre-protective effect of mild hypothermia.
A. Evaluation of MMP of each group. Top: Staining of JC-1 aggregates (red); Middle: Staining of JC-1 monomers (green); Bottom: Marge of Top and Middle. Scale bar corresponds to 10 μm. B. Analysis of MPTP opening of each group with FACS. The median of each group was used to evaluate MPTP opening. C. Expression of cytochrome in mitochondria and kytoplasm. D. Evaluation of HK2 (red) and VDAC (green) expression with immunofluorescence. Scale bar corresponds to 20 μm. E. Gene expression assay with qPCR and western-blot. Similar results were obtained in three independent experiments and results were expressed as mean ± SEM. A t-test was used to compare the various groups, and P<0.05 was considered statistically significant. *: P<0.05 between the two groups.

