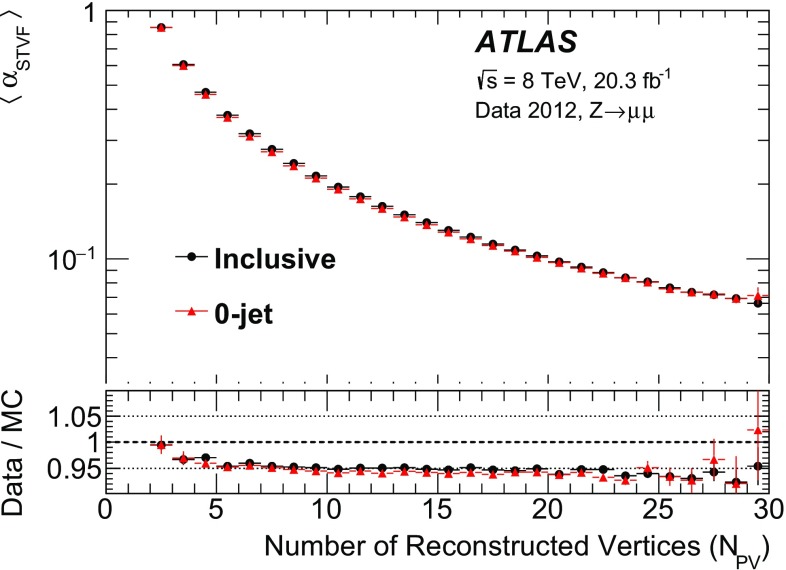
Fig. 2.
The mean weight is shown versus the number of reconstructed vertices () for 0-jet and inclusive events in data. The inset at the bottom of the figure shows the ratio of the data to the MC predictions with only the statistical uncertainties on the data and MC simulation. The bin boundary always includes the lower edge and not the upper edge

