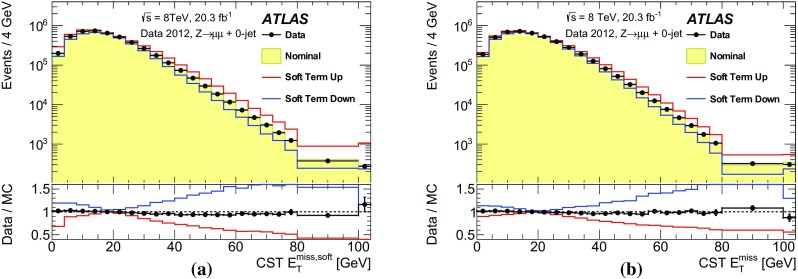
Fig. 25.

Distributions of a and b with the CST algorithm. Data are compared to the nominal simulation distribution as well as those resulting from applying the shifts/smearing according to the scale and resolution systematic uncertainties on the . The resulting changes from the variations are added in quadrature, and the insets at the bottom of the figures show the ratios of the data to the MC predictions. The uncertainties are estimated from the data/simulation ratio in Sect. 8.1.2
