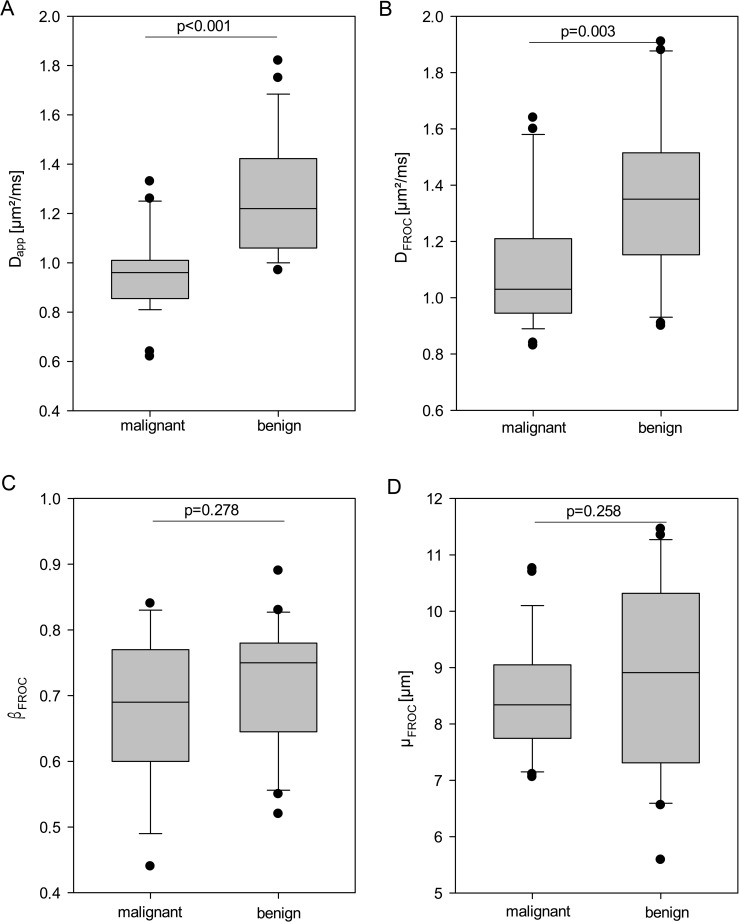
Fig 1. Boxplots.
Boxplots of the mean values for conventional apparent diffusion coefficient Dapp (A) and fractional order calculus (FROC) model derived parameters DFROC (B), βFROC (C) and μFROC (D) for benign and malignant lesions. Vertical bars mark the range of the data excepting outliers, dots mark outliers, box marks 25th– 75th percentile, horizontal bar marks median.

