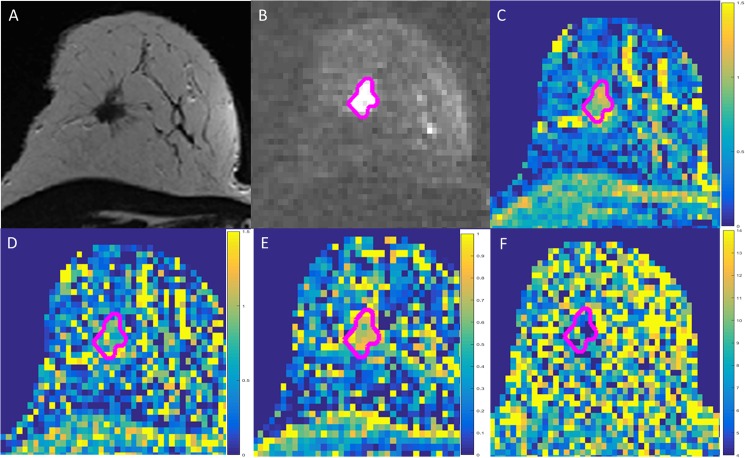
Fig 3. Example of a breast cancer screening participant (66 years).
Lesion with segmentation demonstrated as pink line. A) T2-weighted morphological sequence; B) diffusion weighted imaging (DWI, b = 1500 s/mm2); C) diffusion coefficient map Dapp (scale given in μm2/ms); D) FROC diffusion coefficient map (scale given in μm2/ms); E) βFROC-map demonstrating a more heterogeneous signal; F) μFROC-map demonstrating as well a relatively heterogeneous signal within the entire breast. Histopathology: invasive ductal carcinoma (IDC).

