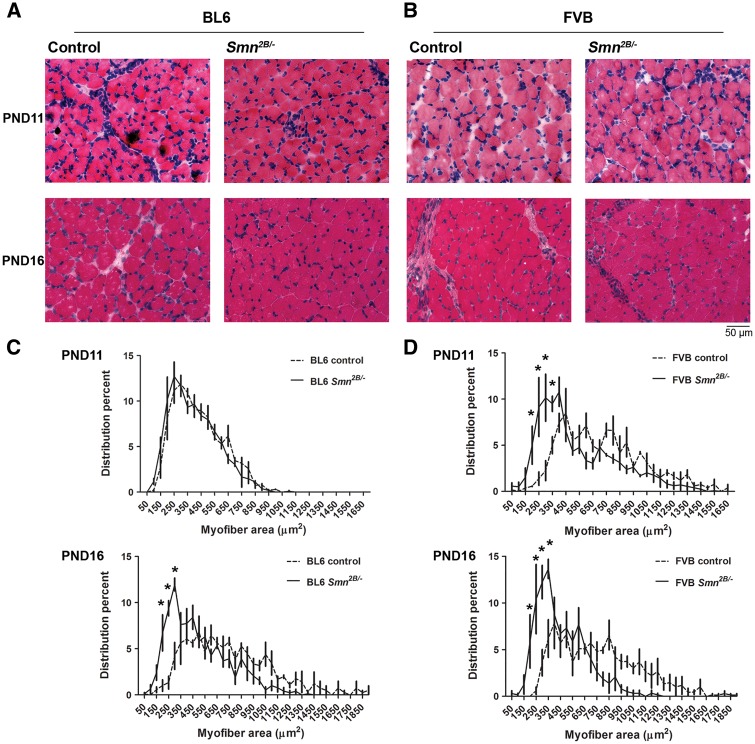
Figure 4.
Muscle fibre cross-sectional area is reduced earlier in FVB Smn2B/-mice than in BL6 Smn2B/-mice. (A and B) Representative images of H&E stained TA muscles from BL6 mice (A) and FVB mice (B) at PND11 and PND16. (C and D) Quantification and analysis of myofibre cross-sectional areas showed that at PND11 there was no difference in the distribution of myofibres of BL6 Smn2B/-mice (n = 3, two way ANOVA, P > 0.05). However, at PND11 there is a higher percentage of small caliber myofibres in FVB Smn2B/-mice compared to their control littermates, and at PND16, the fractions of smaller myofibres are significantly higher in both BL6 and FVB Smn2B/-mice (n = 3, two way ANOVA, P < 0.05). * indicates significant difference between Smn2B/-mice and their control littermates.

