Figure 1.
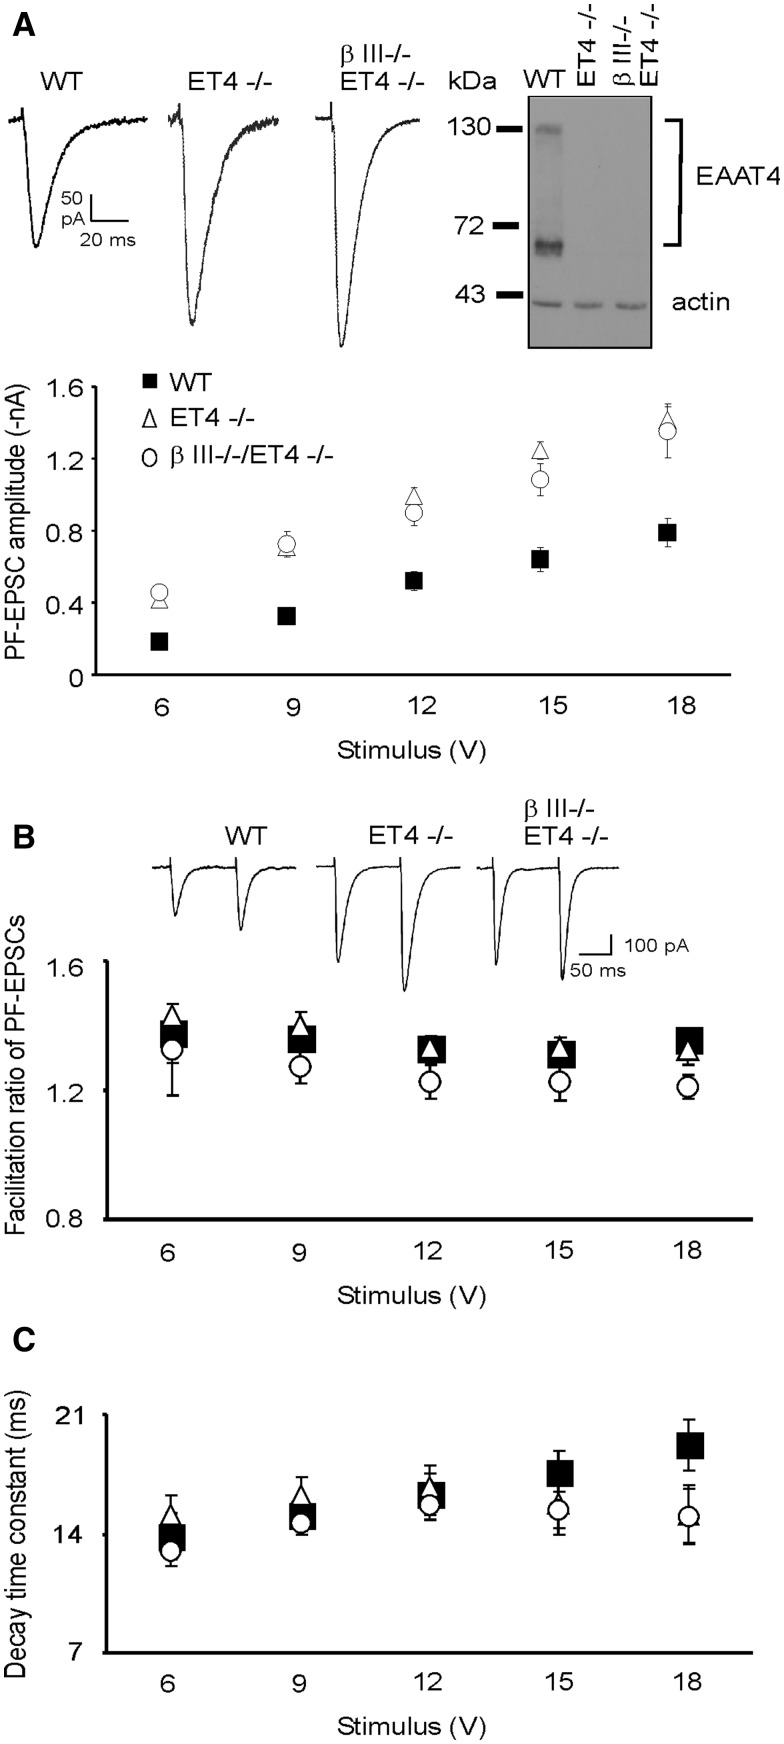
Larger parallel fibre-mediated EPSC amplitude in ET4-/- mice. (A) Top, representative EPSC waveforms at 6 V stimulus and immunoblot analysis for all genotypes. Bottom, mean PF-PC EPSC amplitudes versus stimulus intensity for 6-week old WT, ET4-/- and β-III-/-/ET4-/- animals. No significant differences detected between ET4-/- and β-III-/-/ET4-/- across the range of stimulus intensities but both significantly different to WT animals using mixed model ANOVA analysis. (B) Top, examples of PF-EPSC waveforms for pairs of stimuli at 6 V. Bottom, degree of paired-pulse facilitation. (C) Single exponential decay time constants. All data are means ± SEM, N = 3–5, n = 11 (β-III-/-/ET4-/-), 13 (WT) and 15 (ET4-/-).

