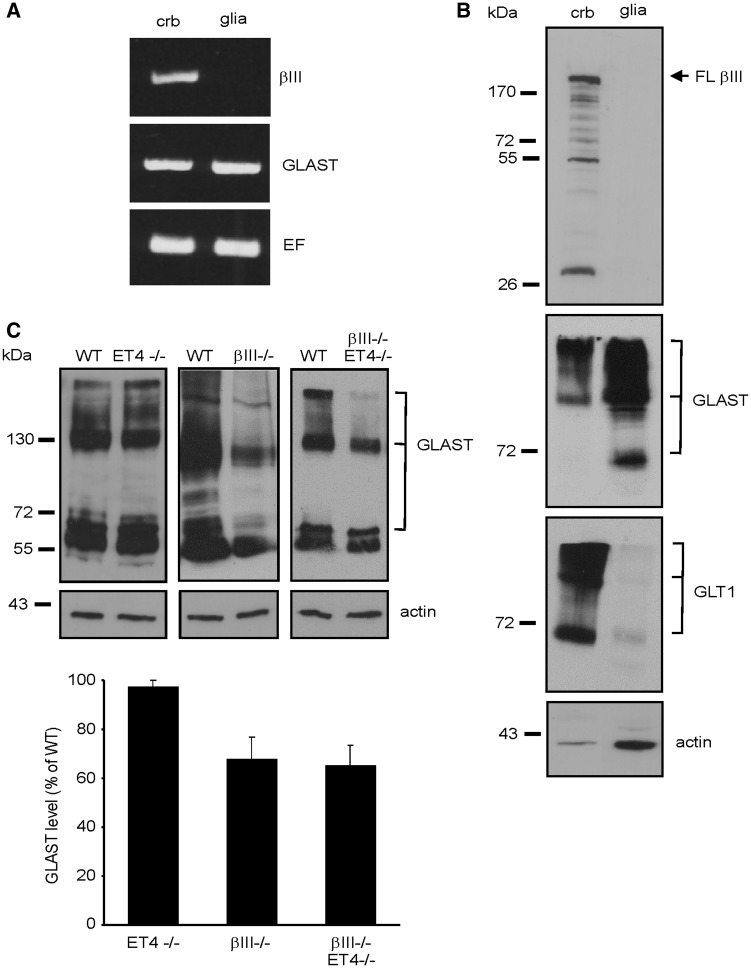
Figure 6.
EAAT4 loss does not result in loss of GLAST. (A) Semi-quantitative RT-PCR analysis for βIII-spectrin and GLAST using RNA template extracted from cerebellar tissue (crb) or primary glial cultures (glia). Amplification of elongation factor (EF1A1) controlled for total template levels. (B) Immunoblot analysis of 10 µg of cerebellar and primary glial culture homogenate (arrow, full length (FL) βIII-spectrin, lower MW bands degradation products). (C) Top, Immunoblot analyses of cerebellar homogenate from 6-month old WT, ET4-/-, βIII-/- and βIII-/-/ET4-/- animals. Bottom, Densitometry data quantifying GLAST protein levels, normalised to actin and expressed as percentage of WT levels. N = 4 for each genotype. All data are means ± SEM.

