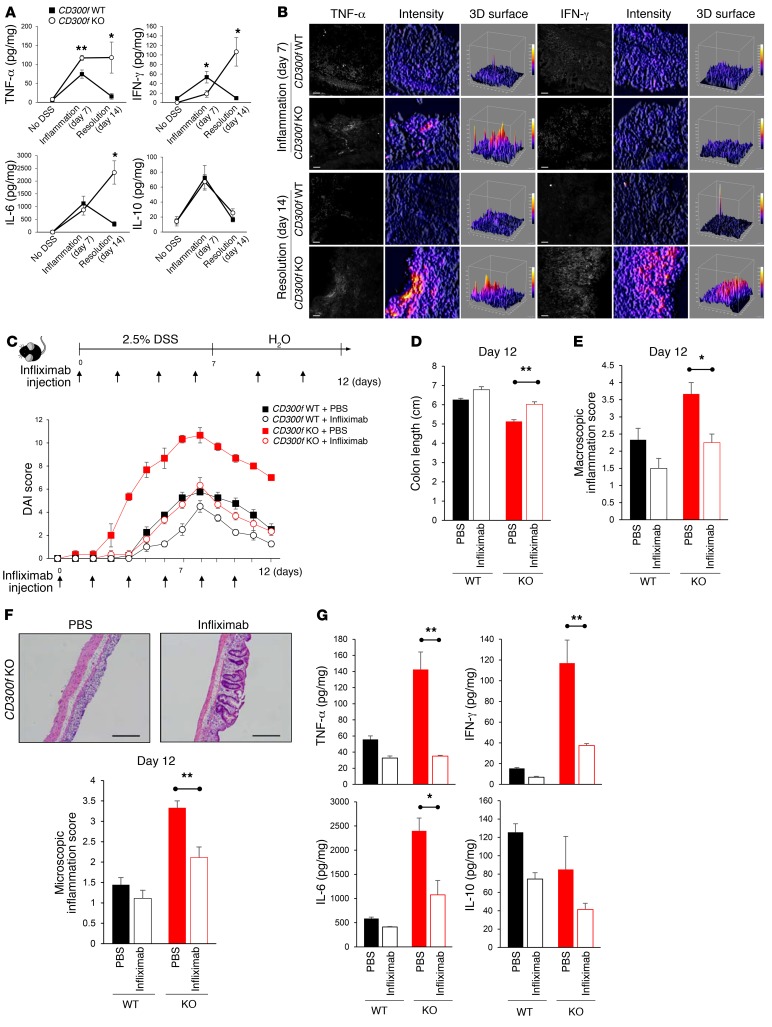
Figure 2. CD300f deficiency leads to sustained and elevated TNF-α production, which is responsible for induction of other proinflammatory cytokines and exacerbation of colonic inflammation.
(A) Mice were treated as indicated in Figure 1A. Cytokine levels in the colon tissues of CD300f+/+ and CD300f–/– mice were determined on day 7 (Inflammation) and day 14 (Resolution). (B) Colon sections from CD300f+/+ and CD300f–/– mice, collected on day 7 (Inflammation) or day 14 (Resolution), were stained for TNF-α or IFN-γ (left panels); scale bars: 20 μm. The fluorescence signal intensity was determined for each image (middle panels) and plotted as 3D surface plots (right panels). (C–G) Infliximab or PBS (vehicle) was injected i.v. to CD300f+/+ or CD300f–/– mice every other day during 2.5% DSS treatment, and every 3 days during the following 5 days. DAI was scored during and after DSS administration; infliximab injection times are indicated (C). On day 12, the colon length (D), macroscopic inflammation score (E), and microscopic inflammation score (F) were determined. The images in F illustrate representative results of H&E staining of the colon tissues from CD300f–/– mice; scale bars: 500 μm. (G) Levels of the indicated cytokines in colon tissue lysates from CD300f+/+ and CD300f–/– mice. All graphs show mean values ± SEM (n = 5, each group). Two-tailed paired Student’s t test was used to determine statistical significance (*P < 0.05, **P < 0.01).

