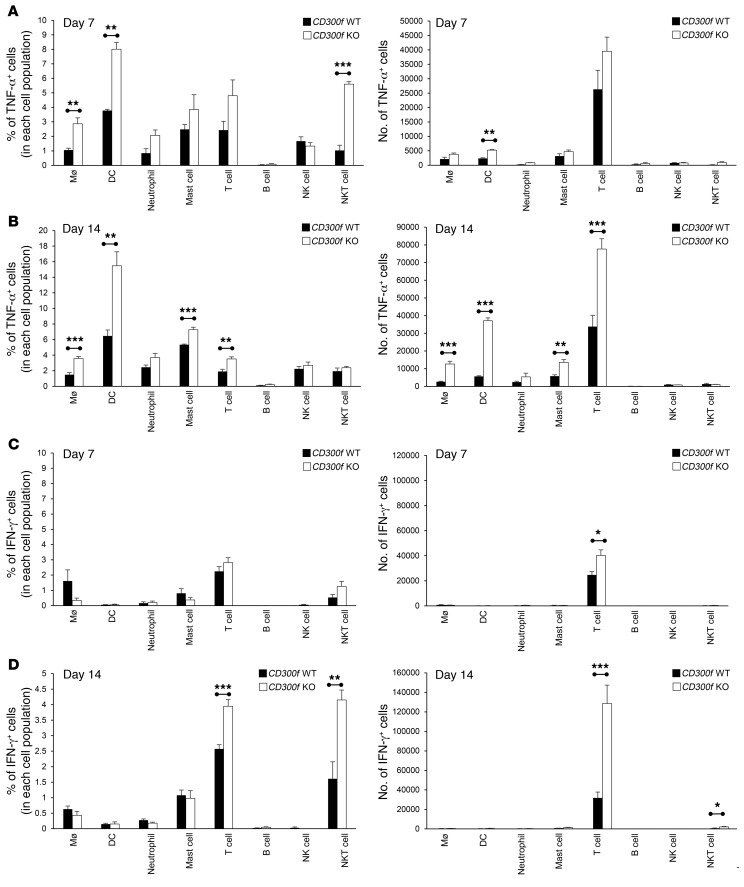
Figure 3. Identification of cells producing TNF-α and IFN-γ in the inflamed colon tissue.
Lamina propria cells were isolated from the colons of DSS-treated CD300f+/+ or CD300f–/– mice, collected on day 7 (A and C) or day 14 (B and D). The intracellular expression of TNF-α and IFN-γ was determined by flow cytometry in the following cell populations: macrophages (CD45+F4/80+CD11b+CD14+Ly6G–CD11c–), DCs (CD45+CD11c+F4/80–Ly6G–CD64–), neutrophils (CD45+CD11b+Ly6G+CD11c–F4/80–), mast cells (CD45+CD11b+FcεRI+), T cells (CD45+CD3+), B cells (CD45+CD3–CD19+), NK cells (CD45+CD3–NK1.1+), and NKT cells (CD45+CD3+NK1.1+). The graphs show the percentages (left) and total numbers (right) of cells expressing TNF-α (A and B) or IFN-γ (C and D). Data are expressed as means + SEM (n = 3–8, each group). Two-tailed paired Student’s t test was used to determine statistical significance (*P < 0.05, **P < 0.01, ***P < 0.001).

