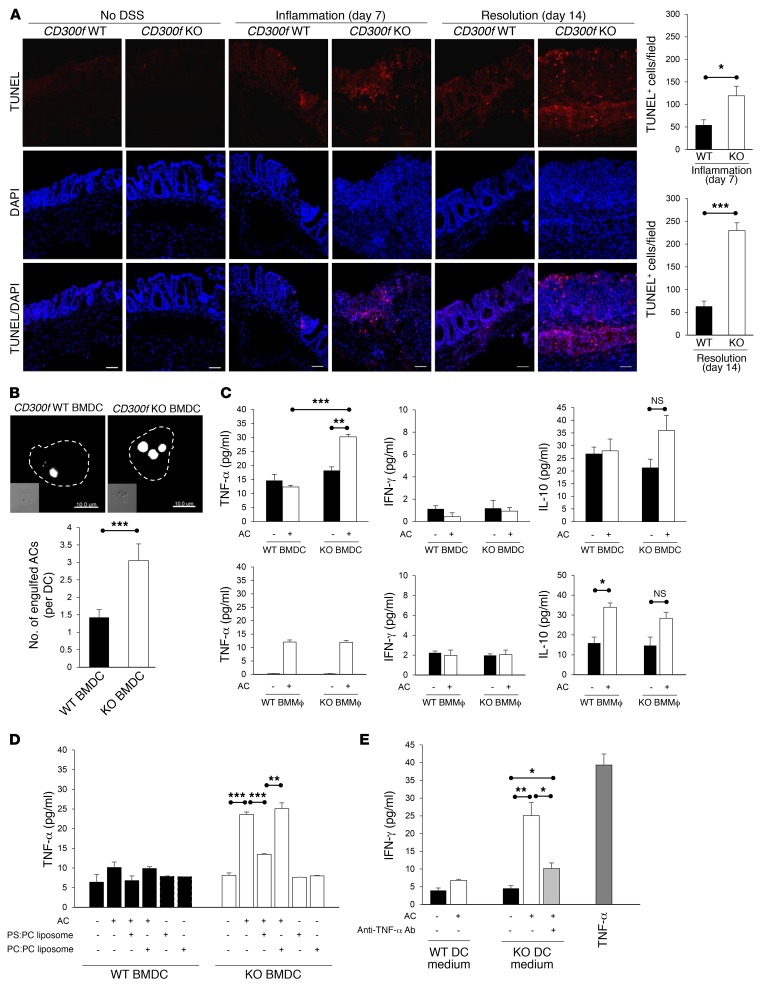
Figure 4. PS-mediated engulfment of ACs by CD300f-deficient DCs induces their TNF-α production, and stimulates IFN-γ secretion by T cells.
(A) The presence of ACs in colons was assessed by TUNEL staining. The images show representative immunofluorescence staining for TUNEL (red) in colon sections from CD300f+/+ and CD300f–/– mice. Nuclei were visualized with DAPI (blue). Scale bars: 50 μm. The graphs show the quantification of TUNEL+ cells per field of view (3 fields per colon section). (B) CD300f+/+ or CD300f–/– BMDCs were coincubated with pHrodo-labeled apoptotic thymocytes for 30 minutes, followed by confocal microscopy analysis. The images (top) show representative images of BMDCs with engulfed ACs (white); scale bars: 10 μm. The graph (bottom) shows the quantification of AC engulfment by BMDCs. (C–E) BMDCs or BMMϕ from CD300f+/+ or CD300f–/– mice were coincubated with apoptotic thymocytes in the absence (C and E) or the presence of PBS, PS:PC liposomes, or PC:PC liposomes (D) for 30 minutes, followed by incubation in a fresh medium for 48 hours. The cell culture media were collected and used to analyze the levels of the indicated cytokines (C and D) or to culture splenic T cells for 48 hours in the presence or absence of anti–TNF-α antibodies (E). To calculate the concentration of IFN-γ released from T cells, the amount of cytokines present in the conditioned media was subtracted from the final values. The media from T cells cultured for 48 hours in the presence of TNF-α (200 ng/ml) were used as a positive control (E). Data are expressed as means + SEM (n = 15, each group in A; n = 50 cells analyzed in 3 independent experiments in B; n = 3 in C–E). Two-tailed paired Student’s t test was used to determine statistical significance (*P < 0.05, **P < 0.01, ***P < 0.001).

