
Fig. 2. Experimental and simulated photoelectron spectra of eaq−.
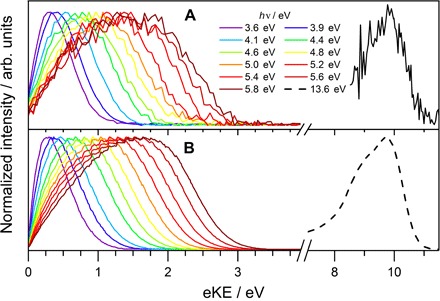
Photoelectron kinetic energy distributions for 12 different ionization laser energies 3.6 eV ≤ hν ≤ 13.6 eV. All spectra are normalized to the same maximum intensity. (A) Experimental spectra. (B) Scattering simulations (section S2 and fig. S5).