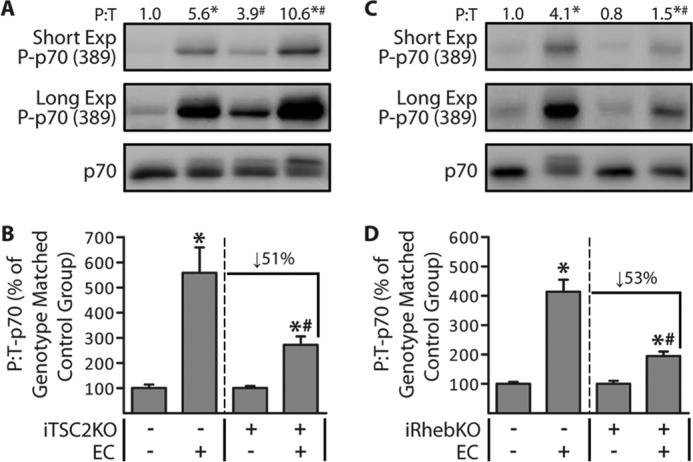
Figure 3.

TSC2 and Rheb significantly contribute to the eccentric contraction-induced activation of mTOR signaling. Six-week-old iTSC2KO−/+ mice (A and B) and iRhebKO−/+ mice (C and D) were treated with 2 mg/day of tamoxifen for 5 days (TAM). At 14 days after TAM, TAs were stimulated with a bout of eccentric contractions (EC+) or the control condition (EC−). At 1 h after stimulation, the TAs were collected and subjected to Western blotting analysis for the indicated proteins. The values above the blots represent the phosphorylated (P) to total protein ratio (P:T) for each group. B, graphical representation of the data in A. D, graphical representation of the data in C, with the P:T ratio of p70 for each group expressed relative to its genotype-matched control (EC−) group. For example, in B, the values for the iTSC2KO+/EC+ group are expressed relative to the values obtained in the iTSC2KO+/EC− group. All values are presented as means (±S.E. in graph, n = 5–8/group). Symbols indicate significant difference (p ≤ 0.05) from the genotype-matched control (EC−) (*) or the stimulation-matched condition in iTSC2KO− (A and B) or iRhebKO− (C and D) (#).
