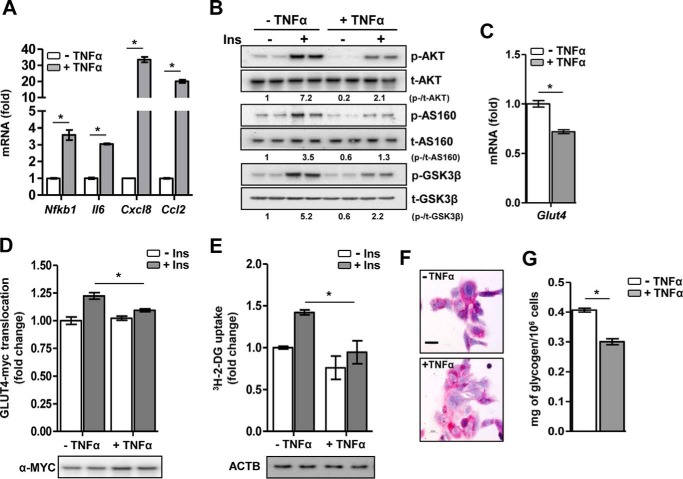
Figure 1.
Characterization of TNFα-induced IR. A, relative mRNA levels of proinflammatory markers. *, p < 0.01 by unpaired Student's t test. B, representative Western-blotting analysis of the insulin (Ins) signaling pathway following insulin stimulation. p, phospho; t, total. C, relative mRNA level of Glut4. *, p < 0.01 by unpaired Student's t test. D, insulin-stimulated GLUT4-myc translocation. *, p = 0.047 by two-way ANOVA with Bonferroni's multiple comparisons post hoc test. E, insulin-stimulated glucose uptake. *, p = 0.041 by two-way ANOVA with Bonferroni's multiple comparisons post hoc test. ACTB, β-actin. F, representative periodic acid-Schiff staining for intracellular glycogen content. Scale bar = 100 μm, ×40 magnification. G, glucose oxidase assay for quantitation of intracellular glycogen content. *, p < 0.01 by unpaired Student's t test. Data are expressed as mean ± S.D. n = 4–5 independent experiments in HL-1 cardiomyocytes.

