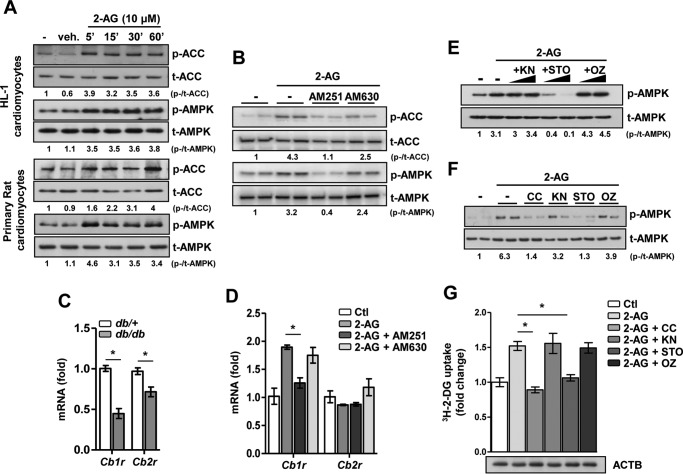
Figure 2.
2-AG activates the AMPK signaling pathway in cardiomyocytes. A, phospho (p-) and total (t-) ACC and AMPK protein levels upon 2AG treatment in HL-1 and primary cardiomyocytes. veh, vehicle. B, phospho and total ACC and AMPK protein levels upon 2-AG treatment for 1 h, preceded by treatment with AM251 or AM630 for 1 h in HL-1 cardiomyocytes. C, relative mRNA levels of Cb1r and Cb2r in cardiac tissues obtained from db/+ (n = 4) and db/db (n = 6) mice. *, p < 0.01 by unpaired Student's t test. D, relative mRNA levels of Cb1r and Cb2r in HL-1 cardiomyocytes upon 2-AG treatment for 1 h, preceded by treatment with AM251 or AM630 for 1 h in HL-1 cardiomyocytes. *, p < 0.01 by one-way ANOVA with Tukey's multiple comparisons post hoc test. Ctl, control. E, phospho and total AMPK protein levels upon 2-AG treatment for 1 h, preceded by treatment with KN, STO, or OZ for 1 h in LKB1-deficient HeLa cells. F, phospho and total AMPK protein levels upon 2-AG treatment for 1 h, preceded by treatment with CC, KN, STO, or OZ for 1 h in primary rat cardiomyocytes. G, glucose uptake in primary rat cardiomyocytes upon 2-AG treatment for 1 h, preceded by treatment with CC, KN, STO, or OZ for 1 h. ACTB, β-actin. *, p < 0.01 by one-way ANOVA with Tukey's multiple comparisons post hoc test. Data are expressed as mean ± S.D. n = 4–5 independent experiments.

