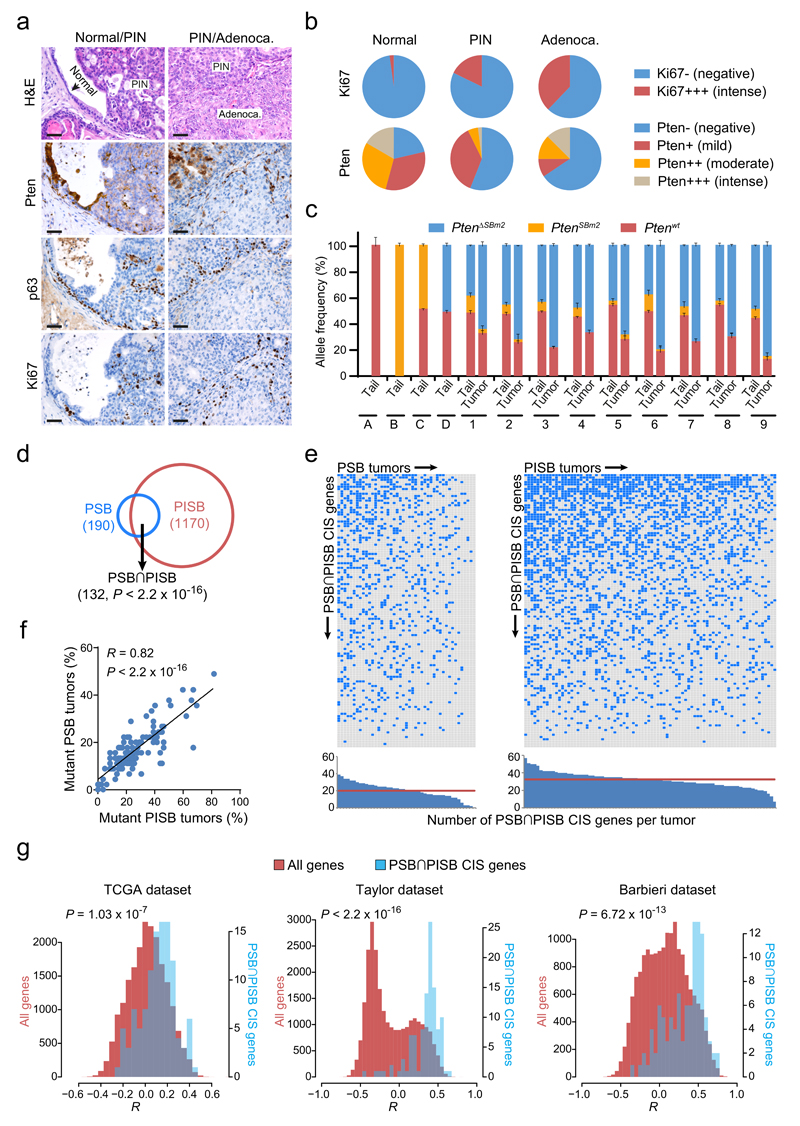
Figure 2. Characterization of Pten-inactivated prostate cancer and identification of large sets of genes potentially driving its progression.
(a) H&E, Pten, p63 and Ki67 stainings of normal tissue, PIN and adenocarcinoma lesions from PSB/PISB mice. Scale bars, 50 µm. (b) Ki67 and Pten staining quantification in normal tissue, PIN and adenocarcinoma components from 114 PSB/PISB prostate tumors. (c) Quantitative PCR for detection/quantification of different Pten alleles in tail/tumor pairs from nine PSB/PISB mice (1 to 9). PtenΔSBm2 represents the targeted Pten allele after transposon mobilization. Tails from Ptenwt/wt (A), PtenSBm2/SBm2 (B), PtenSBm2/wt (C) and PtenΔSBm2/wt (D) mice were used as controls. (d) Overlap between PSB (n=190) and PISB (n=1170) prostate CIS genes. P < 2.2 x 10⁻¹⁶; Fisher’s exact test. (e) Distribution of PSB∩PISB hCIS genes across the 127 prostate tumors analyzed. Blue boxes highlight PSB∩PISB hCIS genes containing SB insertions in each tumor. Histograms show the number of PSB∩PISB hCIS genes with insertions per each tumor. Red horizontal lines represent the median of PSB∩PISB hCIS genes with insertions in PSB/PISB tumors. (f) Correlation between the frequency of PSB/PISB prostate tumors with insertions in each PSB∩PISB hCIS gene (n=117). R, Pearson correlation coefficient. P < 2.2 x 10⁻¹⁶; Pearson’s correlation test. (g) Histograms of the Pearson correlation coefficients (R) between the mRNA expression of PTEN and that of PSB∩PISB hCIS genes (blue bars) or that of all genes in the genome (red bars) in human prostate tumors from TCGA (n=336), Taylor (n=160) and Barbieri (n=31) datasets. P-values were calculated by Kolmogorov-Smirnov test.

