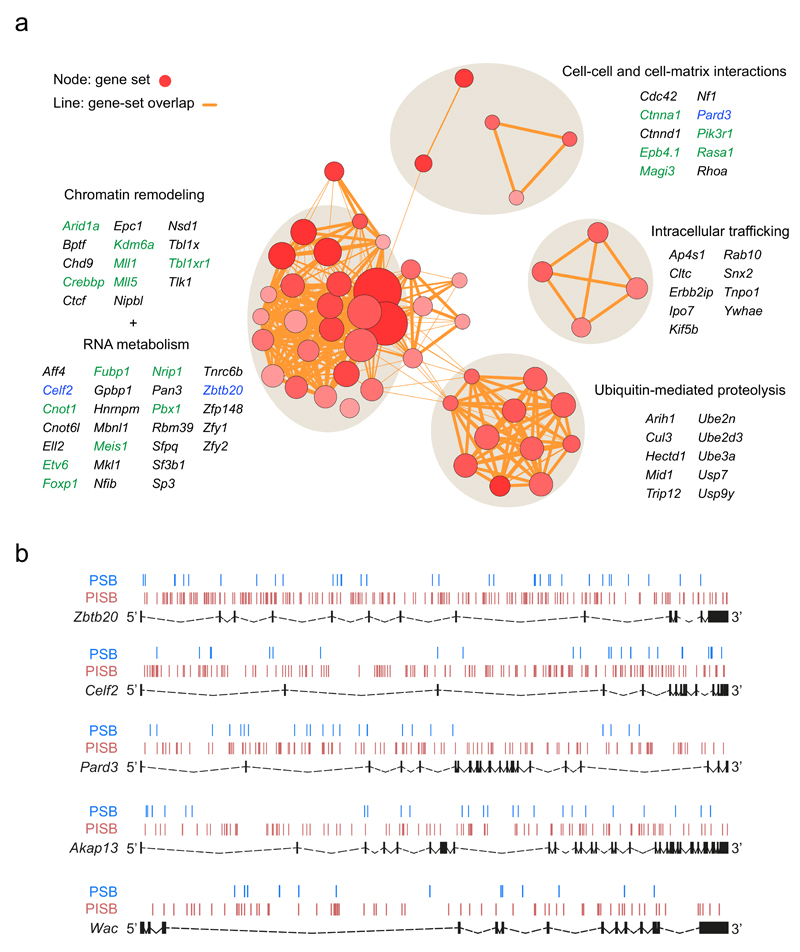
Figure 3. Perturbed biological pathways, cellular processes and novel tumor suppressor candidates enriched among the PSB∩PISB CIS genes.
(a) Enrichment results on the 117 PSB∩PISB CIS genes obtained by DAVID analysis are mapped as a network of gene-sets (nodes) grouped according to their similarity. Only those gene-sets with a Benjamini q-value < 0.1 are represented. Red circles represent nodes (gene-sets). Orange lines represent overlapping between nodes. Node size is proportional to the total number of PSB∩PISB CIS genes in each gene-set. Higher node color intensity represents greater enrichment significance (lower Benjamini q-value) of a particular gene-set. Line thickness shows the degree of overlap (shared genes) between gene-sets. Groups of functionally related gene-sets are circled (round grey shadows) and labelled, and representative genes for each of them are shown. Genes in green are described to be altered in human prostate cancer. Genes in blue represent three out of the five new tumor suppressor genes identified and validated in this work. (b) SB transposon insertion pattern across Zbtb20, Celf2, Pard3, Akap13 and Wac in PSB (blue lines) and PISB (red lines) tumors. Exons are represented as black boxes and introns as dashed lines.

