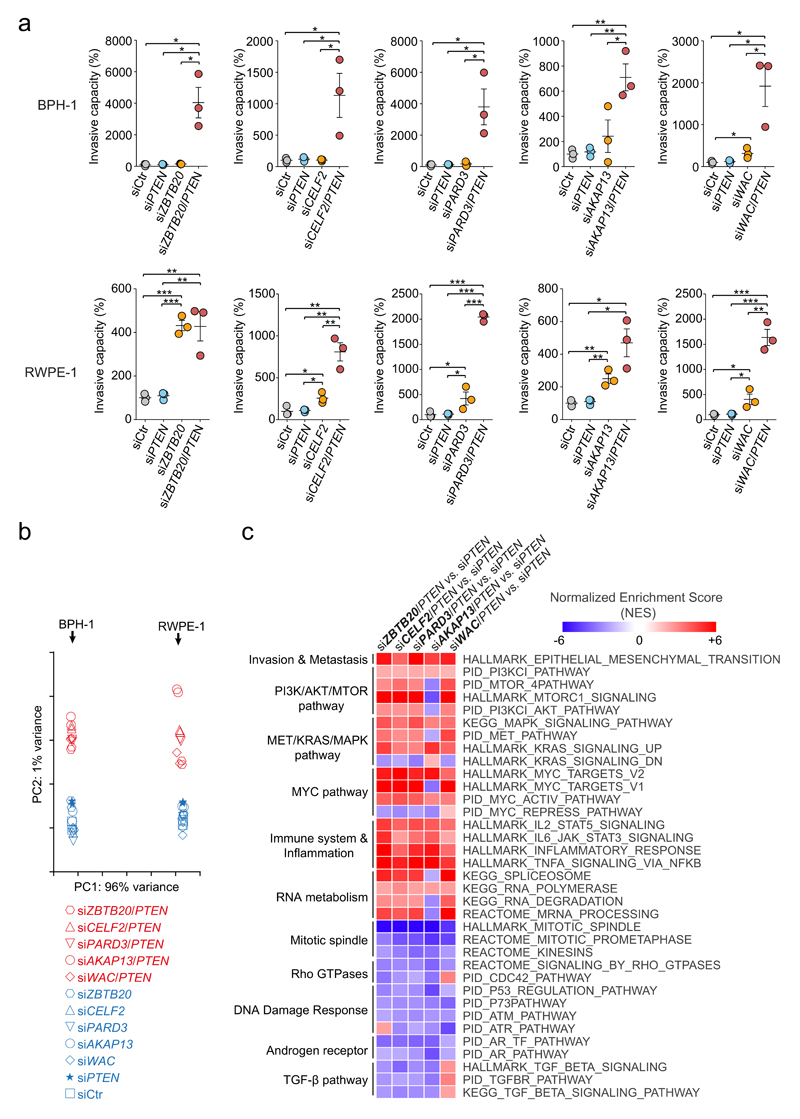
Figure 4. Genetic inhibition of tumor suppressor genes drives prostate cancer progression through canonical signaling pathways.
(a) Effect of ZBTB20, CELF2, PARD3, AKAP13 and WAC silencing, either alone or in combination with PTEN interfering, on the invasiveness of BPH-1 (top panel) and RWPE-1 (bottom panel) immortalized human prostate cell lines. Cell invasion rate is expressed as a percentage relative to the mean of control invasion rate values, which was set as 100%. Each circle represents an individual technical replicate. Horizontal lines represent the means and error bars correspond to s.e.m in each condition. *P < 0.05, **P < 0.01, ***P < 0.001, two-tailed Student’s t test. (b) Principal component analysis of the RNA-seq expression profiles of RWPE-1 and BPH-1 cell lines upon silencing of the five candidate tumor suppressor genes in a, either alone or in combination with Pten interfering. RNA expression profiles from siRNA-Ctr- and siRNA-Pten-treated cells were also included in the analysis. Component one was determined by the specific cell line being analyzed, whereas component two was determined by the status of single gene silencing versus co-silencing with Pten, regardless of the single candidate gene being co-silenced. (c) Heatmap depicting a subset of shared deregulated pathways associated to co-silencing of each of the candidate genes, compared with single Pten-silencing. Selected pathways shared by at least 4 of the co-silencing conditions and with FDR q-values < 0.025 are represented.

