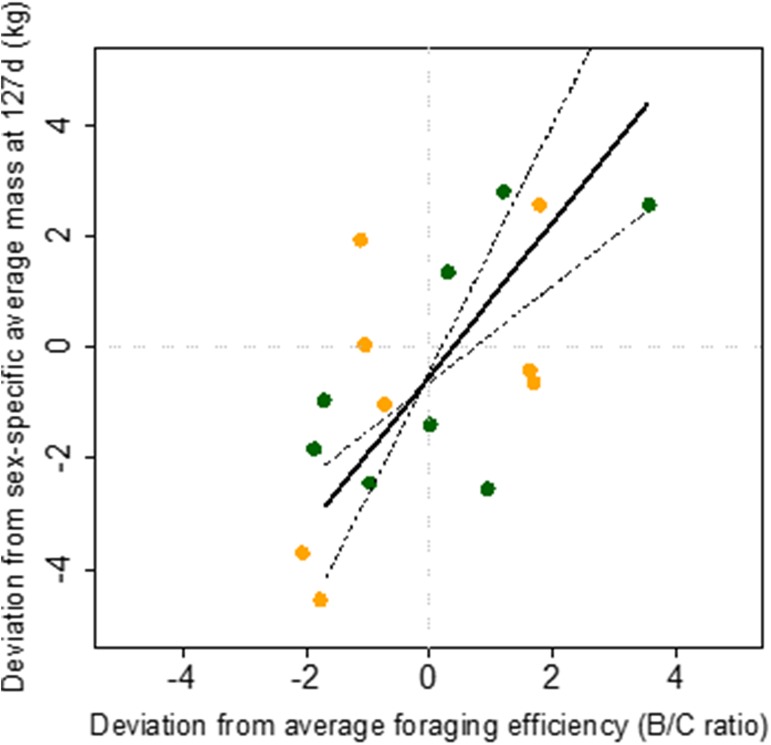
Fig 3. Deviation of individual Antarctic fur seal pup masses at weaning from sex-specific average pup mass at weaning as a function of the deviation of foraging efficiency of individual pup’s mothers from the average foraging efficiency over one foraging trip.
Orange dots are male pups and green dots are female pups. Solid lines show the type II linear regression output (Y = 1.38 X—0.51, p = 0.0078, R2 = 0.41, n = 15. Spearman rank correlation rho = 0.62, p = 0.032).

