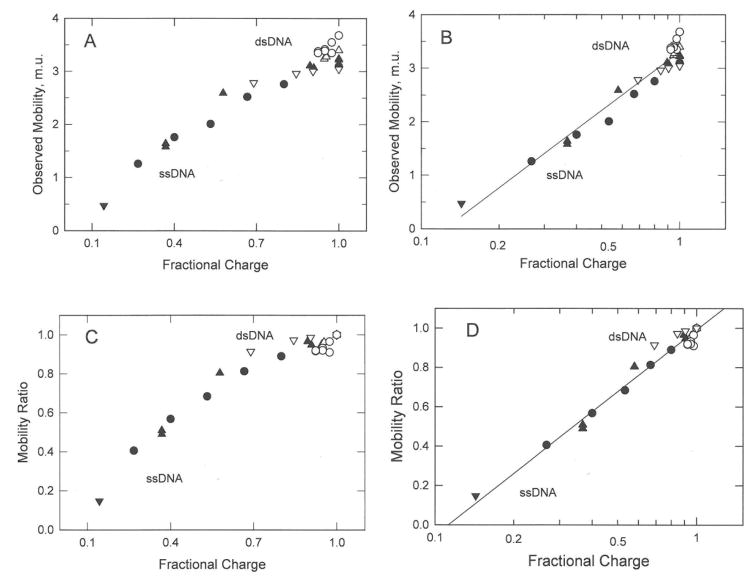
Figure 1.
Dependence of the mobilities and mobility ratios observed for ss- and dsDNA charge variants on: (A) and (C), the fractional charge of the oligomer; and (B) and (D), the logarithm of the fractional charge. The symbols in all panels correspond to: (●), ssDNA-16; (▲), ssDNA-20,23; (▼), ssDNA-8; (o), dsDNA-118; (△), dsDNA-20,23; and (▽), dsDNA-99. The mobilities in this and subsequent figures are given in mobility units, m.u. (1 m.u. = 1 × 10⁻⁴ cm2/Vs). The identities of the DNA samples, BGEs, and references to the original literature are given in Table 1. The straight lines in (B) and (D) were drawn by linear regression; r2 = 0.952 and 0.997, respectively.

