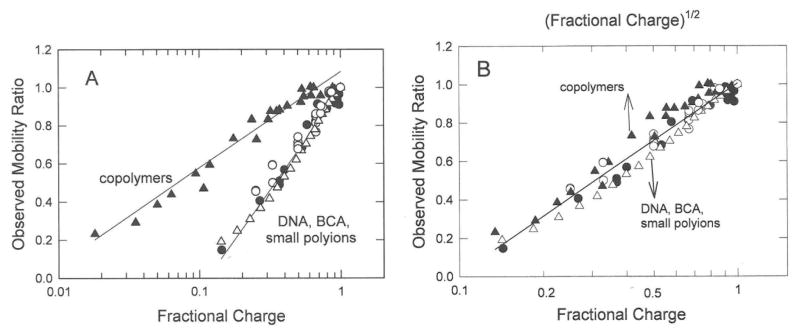
Figure 5.
Comparison of the mobility ratios observed for all polyion charge variants. (A), Observed mobility ratios plotted as a function of the logarithm of the fractional charge. (B), Comparison of the observed mobility ratios of DNA, BCA and small polyions, plotted as a function of the logarithm of the fractional charge (lower axis), with mobility ratios of the copolymers plotted as a function of the square root of the logarithm of fractional charge (upper axis). The symbols in both (A) and (B) correspond to: (●), ss- and dsDNAs; (o), small polyions; (△), BCA charge variants; and (▲), synthetic copolymers. The lines were drawn by linear regression. In (A), r2 = 0.986 for DNA, peptides, BCA and small polyions and 0.976 for the copolymers; in (B), r2 = 0.948 for all polyions.

