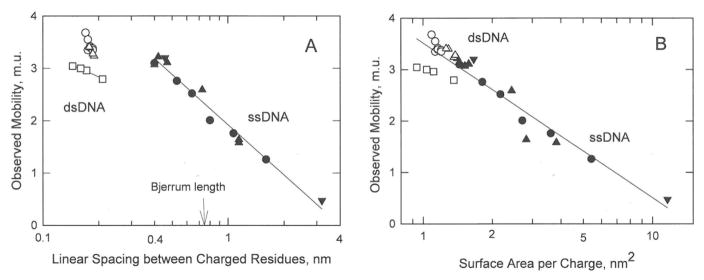
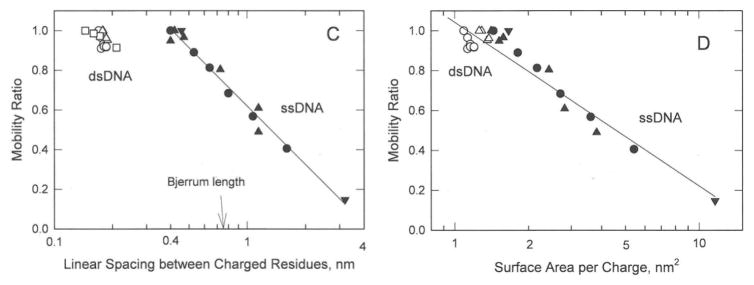
Figure 7.
Dependence of the mobilities and mobility ratios observed for the DNA charge variants on: (A) and (C), the logarithm of the linear spacing between charged residues; and (B) and (D), the logarithm of the surface area per charge. The symbols are the same as in Figure 1. The vertical arrows in (A) and (C) correspond to the Bjerrum length, 0.714 nm in water at 20°C. The lines were drawn by linear regression; r2 = 0.973 and 0.979 for ssDNA in (A) and (C), respectively, and 0.902 and 0.918 for all DNAs in (B) and (D), respectively.


