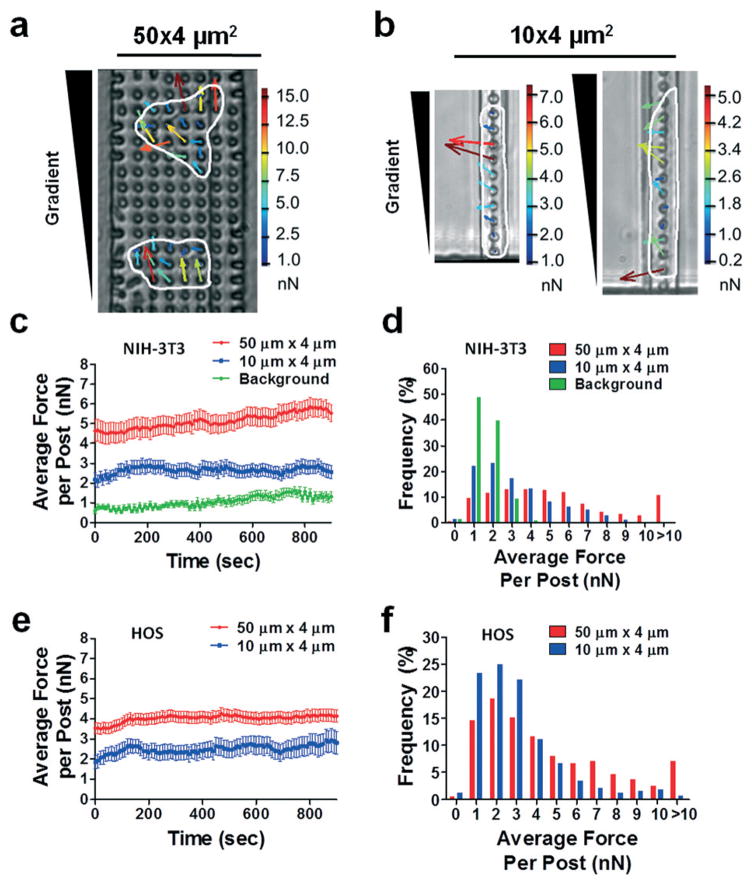
Fig. 3.
Measurement of traction forces exerted by NIH-3T3 and HOS cells in wide and narrow microchannels. Representative phase contrast images of HOS cells migrating through (a) 50 × 4 μm2 and (b) 10 × 4 μm2 microchannels. Cells are outlined for clarity. An FBS gradient was generated by diffusion from an FBS source at the top of the images. Force vectors generated for each micropost are overlaid on the cells. Vector length and color correspond to the magnitude of the traction force, which is indicated on the scale bar to the right of each image. (c, e) Plot of average traction force per post and (d, f) distribution of the traction forces per post for (c, d) NIH-3T3 fibroblasts and (e, f) HOS cells in 50 × 4 μm2 and 10 × 4 μm2 microchannels. For all experiments, micropost tops were coated with 50 μg ml−1 collagen type I. Data represent mean ± SEM from at least n = 20 posts. Background forces remained at ~1 nN per post through remaining experiments and are not indicated on the following plots.

