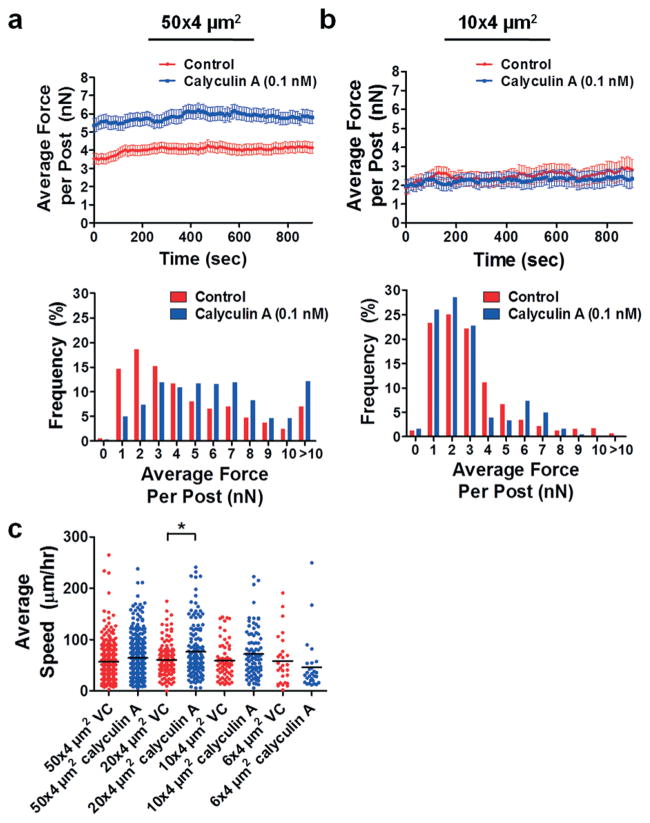
Fig. 5.
Effects of myosin-II activation by calyculin A on traction forces of HOS cells. Plot of average traction force per post and distribution of traction forces per post for HOS cells migrating through (a) 50 × 4 μm2 or (b) 10 × 4 μm2 microchannels in the absence and presence of 0.1 nM calyculin A. For all experiments, micropost tops were coated with 50 μg ml−1 collagen type I. Data represent mean ± SEM from at least n = 20 posts. (c) Plot of average cell speed for control and calyculin A-treated (0.1 nM) HOS cells migrating through microchannels coated with 20 μg ml−1 collagen type I. *, P < 0.01 by one-way ANOVA followed by Tukey’s HSD post-test.

