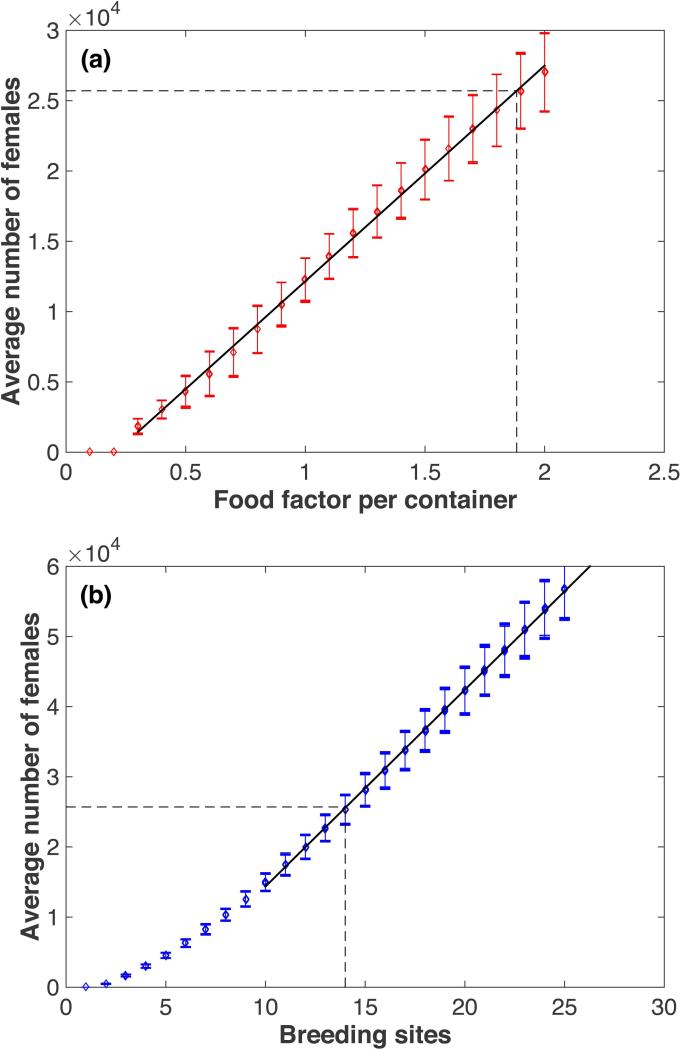
Figure 1.
Calibration of simulated population densities. (a) Top panel: Skeeter Buster model. The average total number of female adults (Nf) in the population is plotted against the value of the food factor per container (FF). The black line shows the linear regression (excluding values where the population is extinct) with the following equation: Nf = −3161 + 15327*FF. (b) Bottom panel: AedesBA model. The average total number of female adults in the population is plotted against the number of breeding sites per grid cell (Nbs). The black line shows the linear regression (restricted to values of Nbs>10) with the following equation: Nf = −13690 + 2805*Nbs. The dashed lines mark the selected values for the population of Iquitos (corresponding to Nf = 25704).

