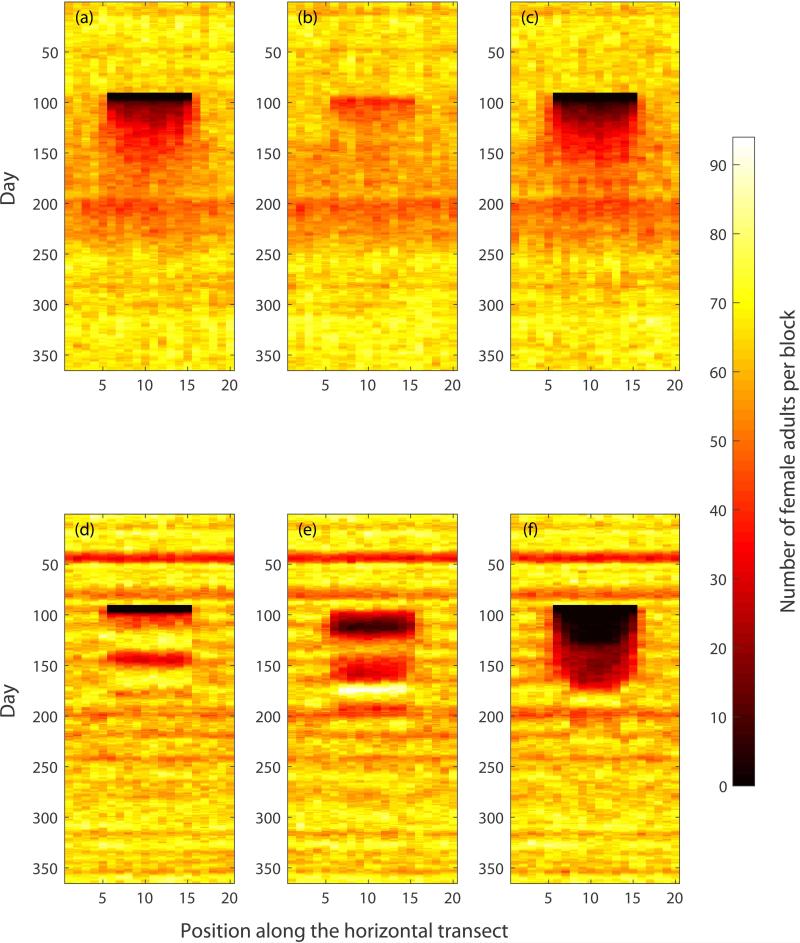
Figure 6.
Evolution of the female adult population along a 20 block transect taken through the center of the grid under various control interventions. The horizontal axis corresponds to the block position along the 20 block transect, the vertical axis corresponds to time. The color corresponds to the number of female adults in a given block according to the color bar on the right. First row (panels (a), (b) and (c)): AedesBA model. Second row (panels (d), (e) and (f)): Skeeter Buster model. First column (panels (a) and (d)): use of adulticide. Second column (panels (b) and (e)): use of larvicide. Third column (panels (c) and (f)): simultaneous use of adulticide and larvicide. Each control strategy was simulated with 100% efficiency during days 90 through 96 in a 10×10 grid in the center of the 20×20 simulation arena. Note that this 7-day window is visible as a black rectangle in panels (a), (c), (d) and (f), where the use of adulticide removes every female adult from the targeted area. All results shown are averages over 5 simulation runs.

