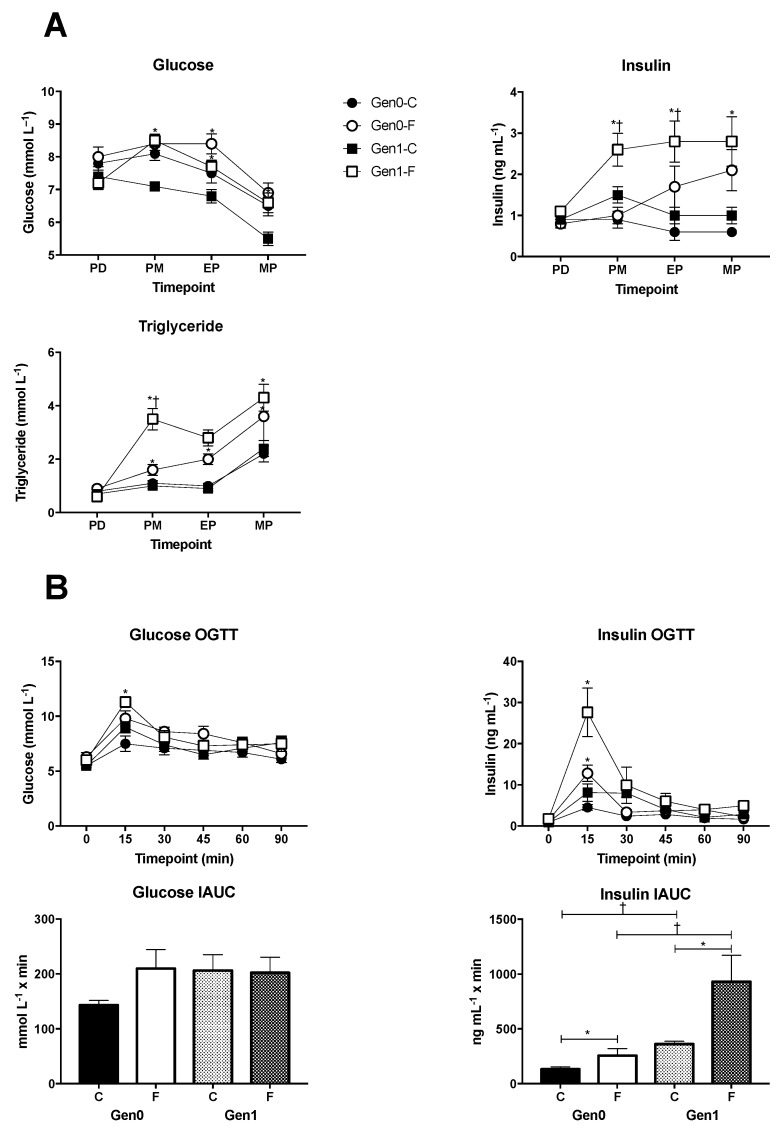
Figure 1.
(A) Plasma glucose, insulin and triglyceride concentrations measured regularly throughout the study. Gen0-C n = 15, Gen0-F n = 15, Gen1-C n = 10, Gen1-F n = 10. Time points were as follows: PD/pre-diet treatment = eight weeks of age, PM/pre-mating = 11 weeks, EP/early pregnancy = 12 weeks/gestational day (GD) 4–7, MP/mid pregnancy = 13 weeks/GD14–17. Whole blood was collected from non-fasted rats and plasma was separated and stored at −20 °C before analysis. (B) Oral glucose tolerance tests (OGTT) were conducted on GD19. Rats were fasted for 4 h. Following collection of a baseline blood sample 3 g·kg–1 body weight of glucose was administered by gavage. Blood samples were collected at 15, 30, 45, 60 and 90 min post glucose bolus. * p < 0.05, Gen0-C vs. Gen0-F, or Gen1-C vs. Gen1-F (effect of diet) and † p < 0.05, Gen0-C vs. Gen1-C and Gen0-F vs. Gen1-F (effect of generation), unpaired t-test with a Bonferroni correction applied for multiple comparisons.

