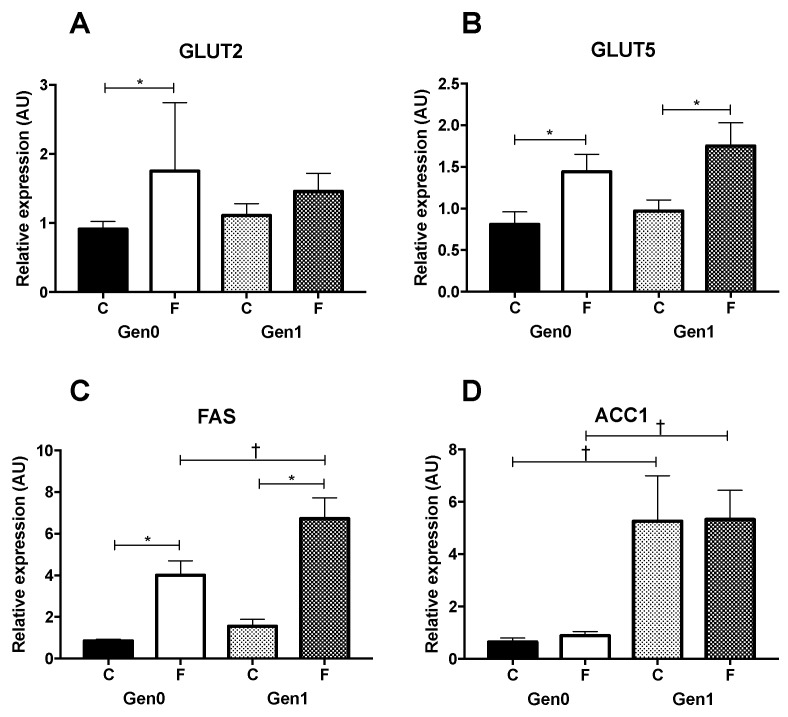
Figure 2.
Hepatic gene expression. Gen0-C n = 10, Gen0-F n = 10, Gen1-C n = 10, Gen1-F n = 10. Livers were excised on gestational day 21 and snap frozen before RNA extraction and cDNA production by reverse transcription PCR. Expression of glucose transporter 2 (GLUT2) (A), fructose transporter GLUT5 (B), fatty acid synthase (FAS) (C) and acetyl-CoA-carboxylase (ACC1) (D) were measured by real-time PCR, relative to the reference genes glyceraldehyde-3-phosphate dehydrogenase (GAPDH) and 60 s acidic ribosomal protein P0 (RPLP0) using GeNorm [15] and the 2−ΔΔCT method [16]. * p < 0.05, Gen0-C vs. Gen0-F, or Gen1-C vs. Gen1-F (effect of diet) and † p < 0.05, Gen0-C vs. Gen1-C and Gen0-F vs. Gen1-F (effect of generation), unpaired t-test with a Bonferroni correction applied for multiple comparisons.

