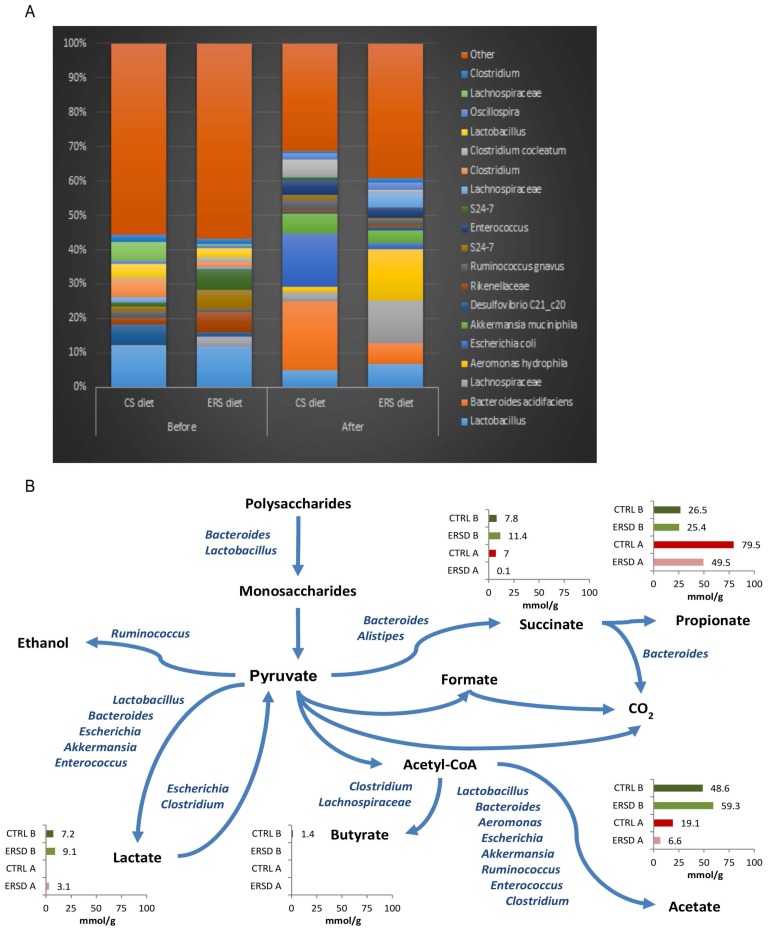
Figure 4.
Composition of bacterial taxa in individual fecal samples. Panel (A) shows the most abundant 20 bacterial taxa of fecal samples, with an average abundance of at least 1% (average sum of reads in relative scale, %). Before and after indicate the time at which samples are taken in respect to cancer treatment; (B) Metabolic scheme and amount of organic acids in mouse fecal samples (mmol/g feces) before (B) and after (A) cancer induction. CTRL—control diet, ERS—resistant starch diet. Bacterial names on the pathway lines indicate the genera identified from the samples.

