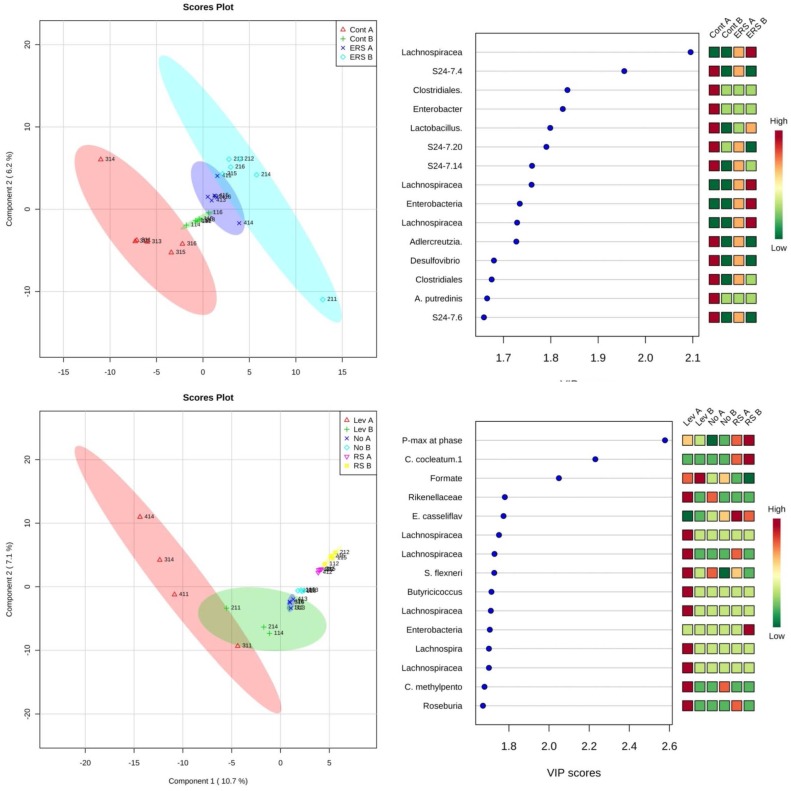
Figure 7.
Score plots of Partial least squares discriminant analysis (PLS-DA) (left) and variable of importance (VIP) scores (right) grouped by substrates used in microcalorimetry. Plots derived from the integrated analysis of microcalorimetric data (total heat accumulated (Q), maximal heat evolution rate (Pmax), specific growth rate (μ), consumption of substrates (levan, amino acids) and formation of products (organic acids, gases and ethanol), and the bacterial genera grown in the microcalorimetry experiments. Analysis was done using the MetaboAnalyst 3.0 program [28]. Lev, NO and RS indicate levan, no added substrate, and resistant starch used in the microcalorimetry experiment, respectively. A and B in the names shows the samples taken before or after the induction of cancer, respectively.

