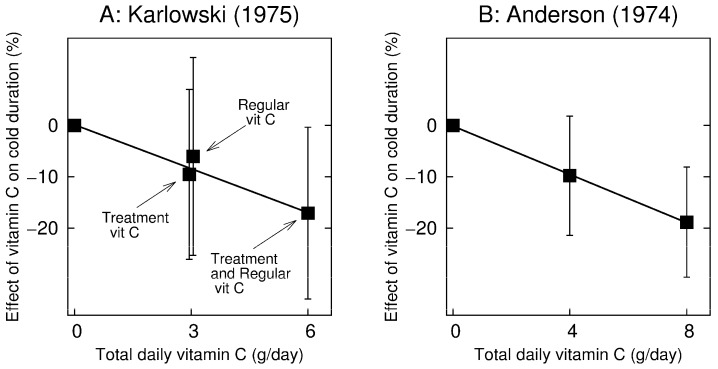
Figure 2.
(A) Dose–response relationship in the Karlowski (1975) trial. The placebo arm is located at 0 g/day, the 3 g/day regular vitamin C and the 3 g/day treatment vitamin C arms are in the middle and the regular + treatment arm is at 6 g/day [72]. The 95% CIs are shown for the comparison against the placebo arm. With inverse-variance weighing, test for trend in a linear model gives p(2-tail) = 0.018. The addition of the linear vitamin C effect to the statistical model containing a uniform vitamin C effect improved the regression model by p = 0.002. Previously, analysis of variance for trend calculated p = 0.040 for the linear trend [83]; (B) Dose–response relationship in the Anderson (1974) trial. The placebo arm #4 is located at 0 g/day, vitamin C treatment arm #7 at 4 g/day and vitamin C treatment arm #8 at 8 g/day [84]. In the Anderson (1974) trial, vitamin C was administered only on the first day of the common cold. The 95% CIs are shown for the comparison against the placebo arm. With inverse-variance weighing, test for trend in a linear model gives p(2-tail) = 0.013. See Supplementary file 2 for the calculation of the trend for both studies.

