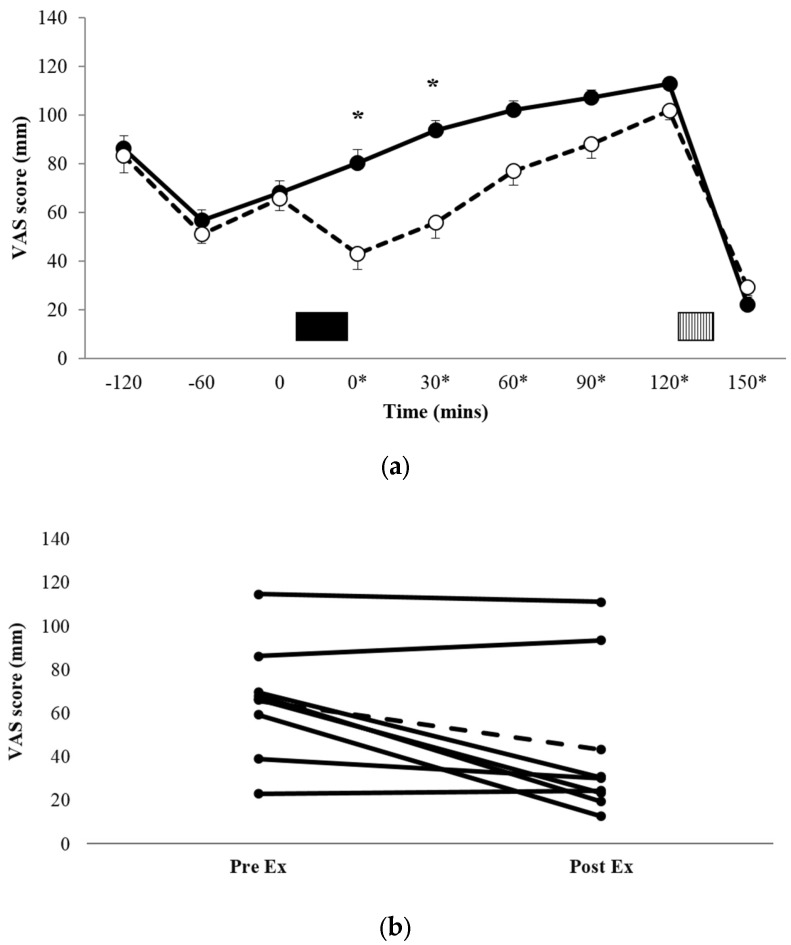
Figure 1.
Mean appetite scores (a) for REST (●, solid line) and EX (○, dashed line). Solid block represents exercise. Stripe block represents the ad libitum test meal. * on x axis labels indicates min post-exercise. Values are mean ± SEM. * = exercise significantly different to rest, p < 0.05. Individual appetite responses immediately post exercise (b) are also shown for EX. The dashed line represents the mean response.

