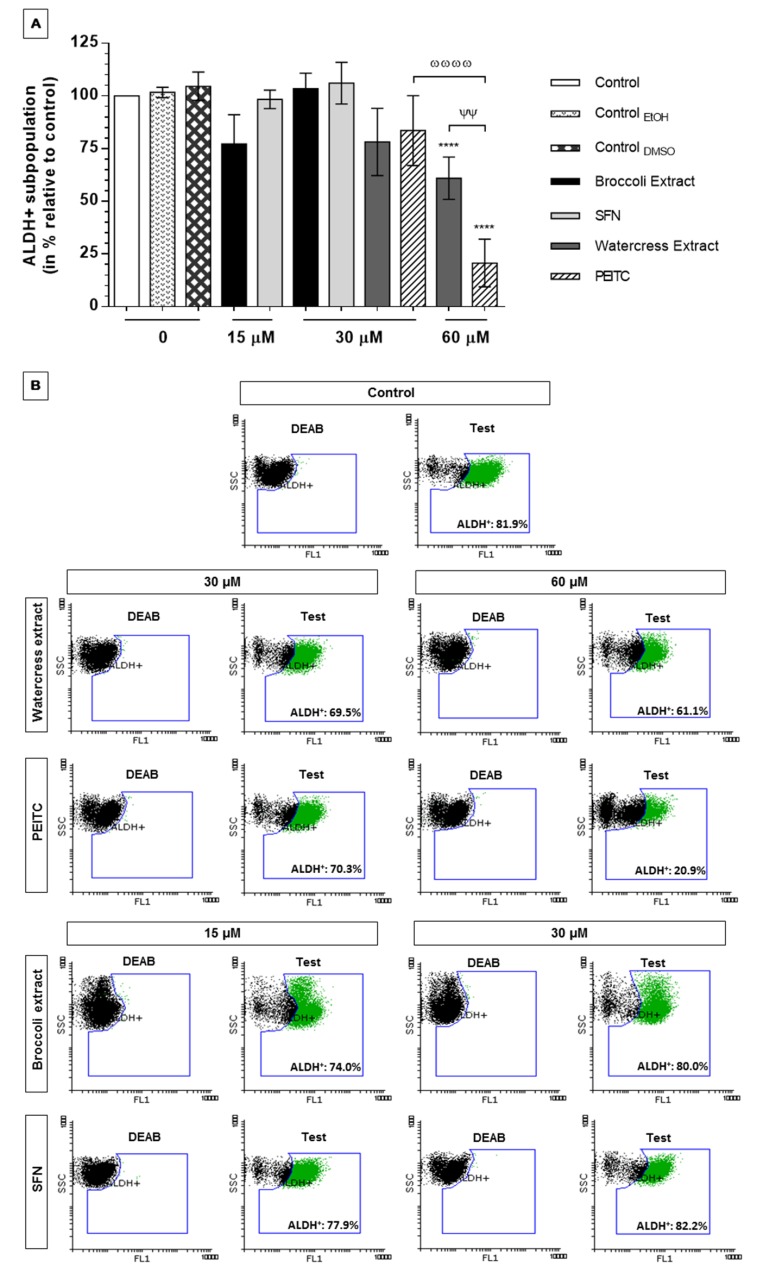
Figure 5.
ALDH1 activity in HT29 spheroids after exposition to watercress and broccoli extracts and respective main ITCs, PEITC and SFN, for 24 h assessed by the ALDEFLUOR™ assay. ALDH1 activity was assessed after treatment with submaximal dosages of all phytochemicals, more precisely with ½ and ¼ of extracts’ EC50 values obtained in 3D antiproliferative assay. (A) Effect of natural extracts and ITCs in ALDH1 activity normalized relatively to control without treatment or solvent (100% ALDH1 activity). Results are means of at least two independent experiments performed in duplicate ± SD; a p < 0.05 was considered as statistically significant. **** p < 0.0001 is relative to control; ѰѰ p < 0.01 is relative to watercress extract and ωωωω p < 0.0001 is relative to the same compound; (B) Representative dot-plots of ALDH1 subpopulations in HT29 spheroids from flow cytometry analysis using ALDEFLUOR™ assay. Negative control was treated with DEAB (ALDH1 inhibitor). The content of ALDH+ cells for each representative sample is indicated as % relatively to total cell population.

