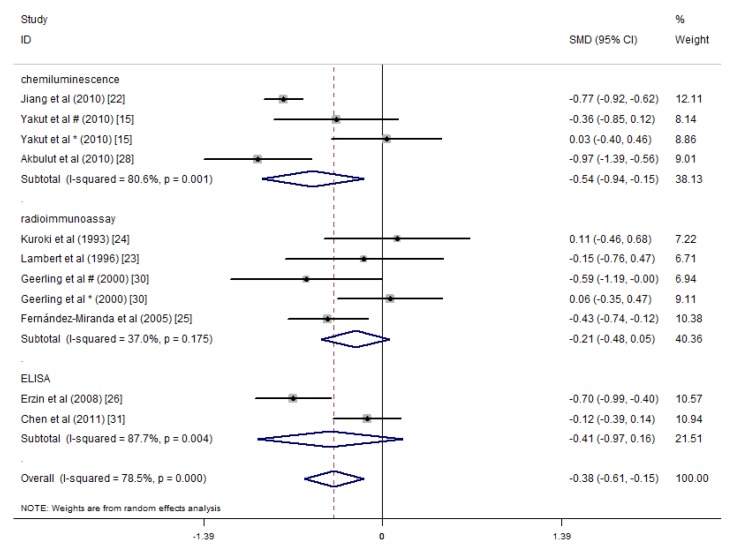
Figure 9.
Forest plot of the serum concentrations of vitamin B12 in IBD patients vs. controls; standardized mean differences with a 95% confidence interval and weight percentage are shown. Subtotals are for the three detection methods. * Reported in ulcerative colitis; # reported in Crohn’s disease.

