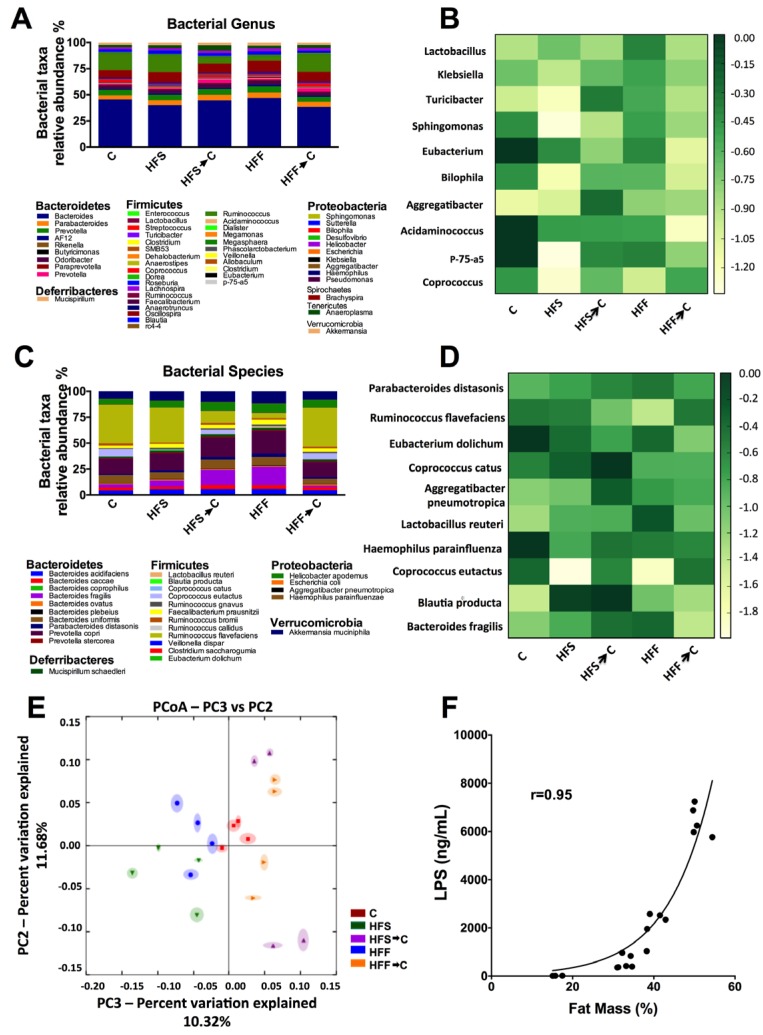
Figure 2.
High-fat sucrose (HFS) or high-fat fructose (HFF) diets differentially modified the gut microbiota. Relative abundances of the gut microbiota at the bacterial genus (A); heat map showing the 10 most modified genera (B); relative abundances at the specie level (C); and heat map showing the ten most modified species (D) after the consumption of HFS or HFF diets. Unweighted principal component analysis (PCA) of gut microbiota after the consumption of different diets (E). The closer the spatial distance between samples the more similar they are with respect to both axes (PERMANOVA, p = 0.001). Correlation between serum LPS concentration and percent fat mass (r = 0.95) (F). The data are expressed as the mean ± SEM (n = 4). Results were considered statistically significant at p < 0.05. The differences between groups are indicated by letters, where a > b > c. C: control; HFS: high-fat and sucrose; HFS→C: high-fat and sucrose, switched to the control diet; HFF: high-fat and fructose; HFS→C: high-fat and fructose, switched to control diet.

