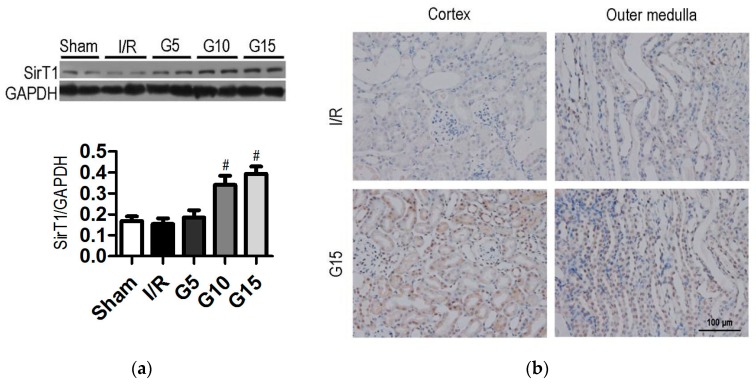
Figure 2.
Effect of genistein on SIRT1 expression following I/R injury. Mice were treated as described in Figure 1. The data were expressed as the mean ± SEM; n = 6; # p < 0.05 vs. I/R. (a) Western blots analysis for SIRT1 expression in mouse kidney tissues. Densitometric analysis of the SIRT1 expression by Image-Pro Plus 6.0. GAPDH was calibrated; (b) Representative images of SIRT1 expression in the kidney, as determined by IHC. Original magnification, 400×. The black arrows indicate the positive cells.

